Industrials › Services-Computer Processing And Data Preparation

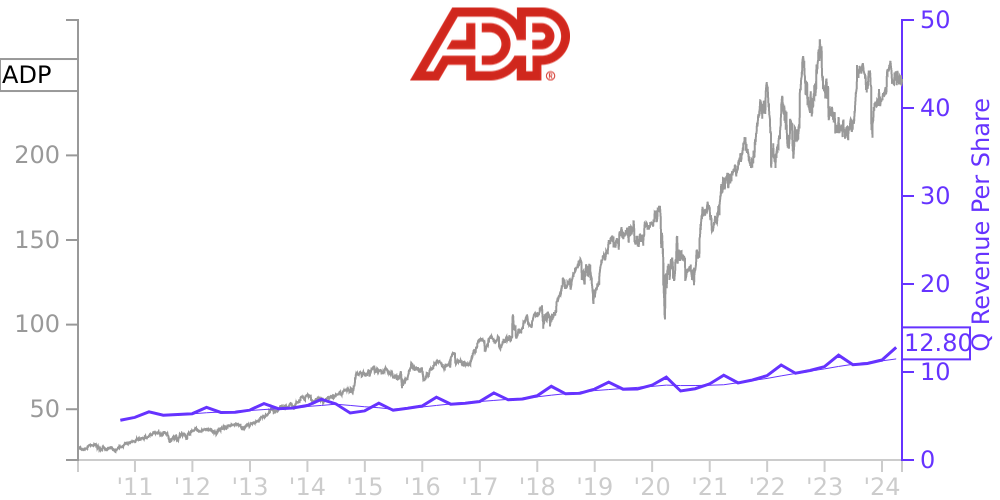
ADP Stock Price Correlated With Automatic Data Processing Financials
External Links ⌄
Income Statement
Cash Flow
Balance Sheet
ADP Income Statement
Enable JavaScript and reload
Revenue, Net:
Cost of Goods & Services Sold:
Gross Profit:
Selling, General & Admin Expense:
Research & Development Expense:
Total Operating Expenses:
Operating Income:
Income Taxes:
Net Income:
ADP Cash Flow
Enable JavaScript and reload
Operating Activities Net Income:
Depreciation, Depletion & Amortization:
Change in Accounts Receiveable:
Net Cash from Operations:
Repurchases/Buybacks Common Stock:
Issuance of Long-term Debt:
Cash Dividends Paid:
Net Cash from Financing Activities:
Property, Plant & Equipment Purchases:
Purchases of Businesses, Net of Cash:
Net Cash from Investing Activities:
Net Change in Cash & Equivalents:
ADP Balance Sheet
Enable JavaScript and reload
Cash and Cash Equivalents:
Short-Term Investments:
Accounts Receivable, Net:
Inventories:
Total Current Assets:
Property, Plant & Equipment, Net:
Total Assets:
Accounts Payable:
Current Portion of Long-Term Debt:
Total Short-Term Liabilities:
Long Term Debt, Non-Current Portion:
Total Long-Term Liabilities:
Total Liabilities:
COMPANY PROFILE
Basis of Presentation The accompanying Consolidated Financial Statements and footnotes thereto of Automatic Data Processing, Inc., its subsidiaries and variable interest entity (“ADP” or the “Company”) have been prepared in accordance with accounting principles generally accepted in the United States of America (“U.S. GAAP”). The Consolidated Financial Statements and footnotes thereto are unaudited. In the opinion of the Company’s management, the Consolidated Financial Statements reflect all adjustments, which are of a normal recurring nature, that are necessary for a fair presentation of the Company’s interim financial results.
The Company has a grantor trust, which holds the majority of the funds provided by its clients pending remittance to employees of those clients, tax authorities, and other payees. The Company is the sole beneficial owner of the trust. The trust meets the criteria in Accounting Standards Codification (“ASC”) 810, “Consolidation” to be characterized as a variable interest entity (“VIE”). The Company has determined that it has a controlling financial interest in the trust because it has both (1) the power to direct the activities that most significantly impact the economic performance of the trust (including the power to make all investment decisions for the trust) and (2) the right to receive benefits that could potentially be significant to the trust (in the form of investment returns) and, therefore, consolidates the trust. Further information on these funds and the Company’s obligations to remit to its clients’ employees, tax authorities, and other payees is provided in Note 6, “Corporate Investments and Funds Held for Clients.”
The preparation of financial statements in conformity with U.S. GAAP requires management to make estimates and assumptions that affect the assets, liabilities, revenue, expenses, and accumulated other comprehensive income that are reported in the Consolidated Financial Statements and footnotes thereto. Actual results may differ from those estimates. Interim financial results are not necessarily indicative of financial results for a full year. The information included in this Quarterly Report on Form 10-Q should be read in conjunction with the Company’s Annual Report on Form 10-K for the fiscal year ended June 30, 2021 (“fiscal 2021”). Certain amounts from the prior year's financial statements have been reclassified in order to conform to the current year's presentation.
Free historical financial statements for Automatic Data Processing Inc. See how revenue, income, cash flow, and balance sheet financials have changed over 63 quarters since 2010. Compare with ADP stock chart to see long term trends.
Data imported from Automatic Data Processing Inc SEC filings. Check original filings before making any investment decision.