Energy › Wholesale-Petroleum And Petroleum Products (No Bulk Stations)

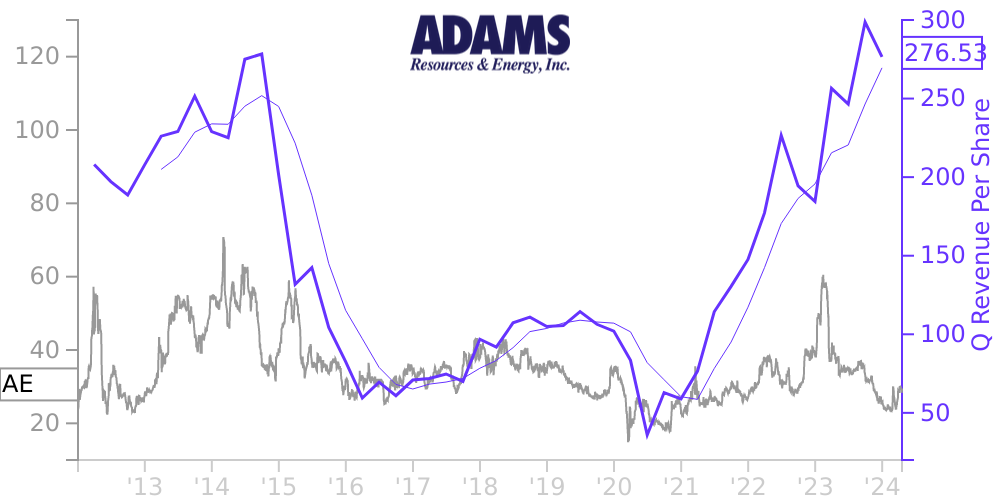
AE Stock Price Correlated With Adams Resources & Energy Financials
External Links ⌄
Income Statement
Cash Flow
Balance Sheet
AE Income Statement
Enable JavaScript and reload
Revenue, Net:
Cost of Goods & Services Sold:
Gross Profit:
Selling, General & Admin Expense:
Research & Development Expense:
Total Operating Expenses:
Operating Income:
Income Taxes:
Net Income:
AE Cash Flow
Enable JavaScript and reload
Operating Activities Net Income:
Depreciation, Depletion & Amortization:
Change in Accounts Receiveable:
Net Cash from Operations:
Repurchases/Buybacks Common Stock:
Issuance of Long-term Debt:
Cash Dividends Paid:
Net Cash from Financing Activities:
Property, Plant & Equipment Purchases:
Purchases of Businesses, Net of Cash:
Net Cash from Investing Activities:
Net Change in Cash & Equivalents:
AE Balance Sheet
Enable JavaScript and reload
Cash and Cash Equivalents:
Short-Term Investments:
Accounts Receivable, Net:
Inventories:
Total Current Assets:
Property, Plant & Equipment, Net:
Total Assets:
Accounts Payable:
Current Portion of Long-Term Debt:
Total Short-Term Liabilities:
Long Term Debt, Non-Current Portion:
Total Long-Term Liabilities:
Total Liabilities:
COMPANY PROFILE
Organization and Basis of Presentation Organization
Adams Resources & Energy, Inc. is a publicly traded Delaware corporation organized in 1973, the common shares of which are listed on the NYSE American LLC under the ticker symbol “AE”. Through our subsidiaries, we are primarily engaged in crude oil marketing, transportation, terminalling and storage in various crude oil and natural gas basins in the lower 48 states of the United States (“U.S.”). We also conduct tank truck transportation of liquid chemicals, pressurized gases, asphalt and dry bulk primarily in the lower 48 states of the U.S. with deliveries into Canada and Mexico, and with nineteen terminals across the U.S. Unless the context requires otherwise, references to “we,” “us,” “our” or the “Company” are intended to mean the business and operations of Adams Resources & Energy, Inc. and its consolidated subsidiaries.
We operate and report in three business segments: (i) crude oil marketing, transportation and storage; (ii) tank truck transportation of liquid chemicals, pressurized gases, asphalt and dry bulk; and (iii) pipeline transportation, terminalling and storage of crude oil. See Note 9 for further information regarding our business segments.
The consolidated financial statements and the accompanying notes are prepared in accordance with U.S. generally accepted accounting principles (“GAAP”) and the rules of the U.S. Securities and Exchange Commission (“SEC”). All significant intercompany transactions and balances have been eliminated in consolidation.
Use of Estimates
The preparation of our financial statements in conformity with GAAP requires management to use estimates and assumptions that affect the reported amount of assets and liabilities and disclosure of contingent assets and liabilities at the date of the financial statements and the reported amounts of revenues and expenses during the reporting period. We base our estimates and judgments on historical experience and on various other assumptions and information we believe to be reasonable under the circumstances. Estimates and assumptions about future events and their effects cannot be perceived with certainty and, accordingly, these estimates may change as new events occur, as more experience is acquired, as additional information is obtained and as the operating environment changes. While we believe the estimates and assumptions used in the preparation of the consolidated financial statements are appropriate, actual results could differ from those estimates.
Free historical financial statements for Adams Resources & Energy Inc.. See how revenue, income, cash flow, and balance sheet financials have changed over 51 quarters since 2012. Compare with AE stock chart to see long term trends.
Data imported from Adams Resources & Energy Inc. SEC filings. Check original filings before making any investment decision.