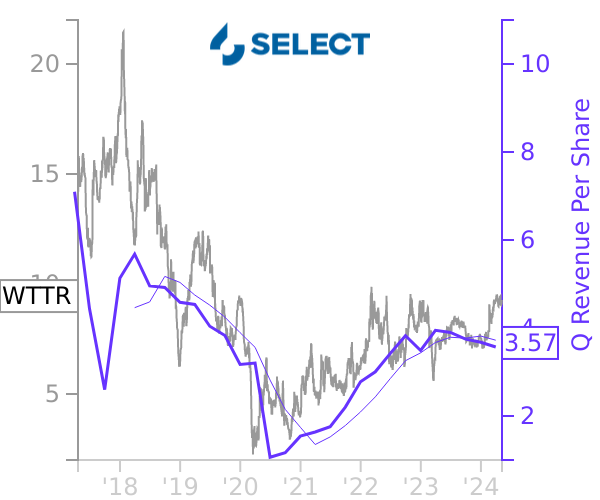
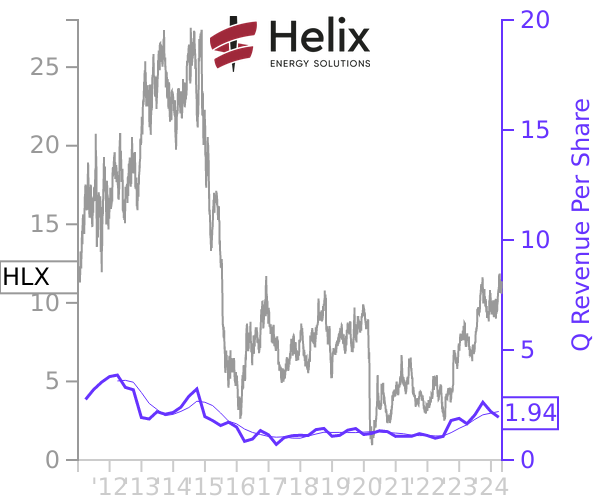
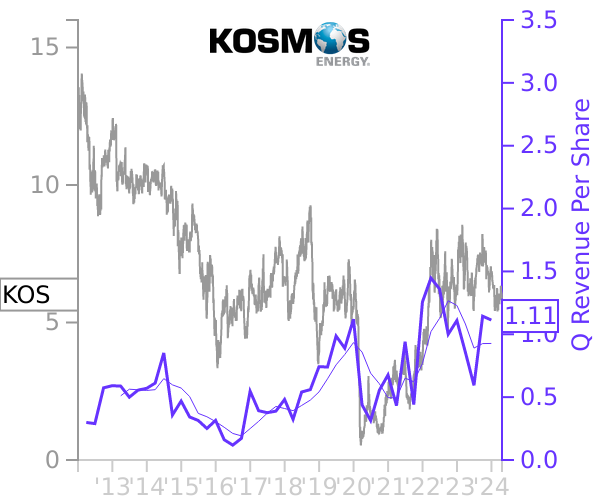
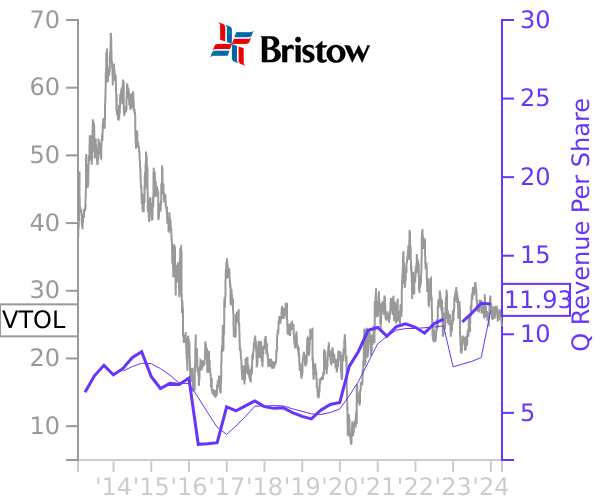
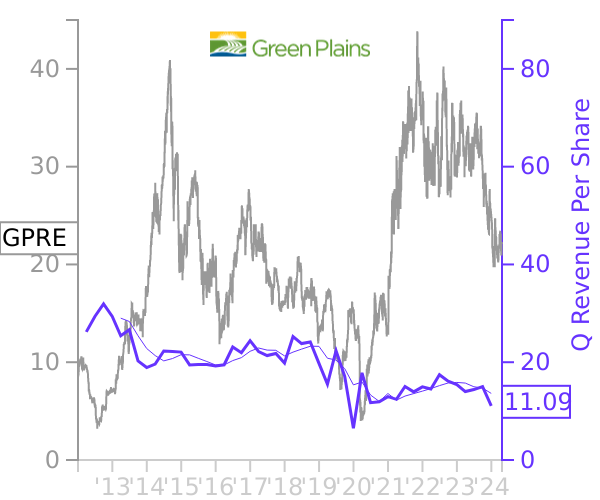
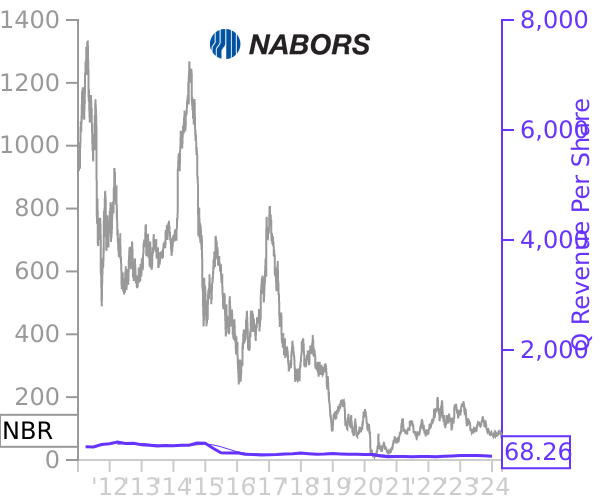
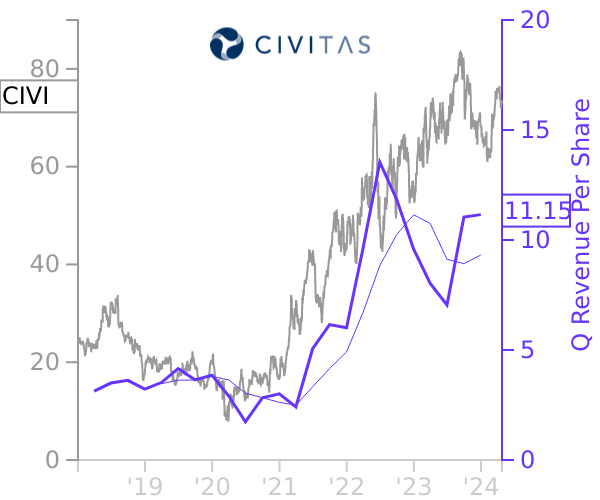
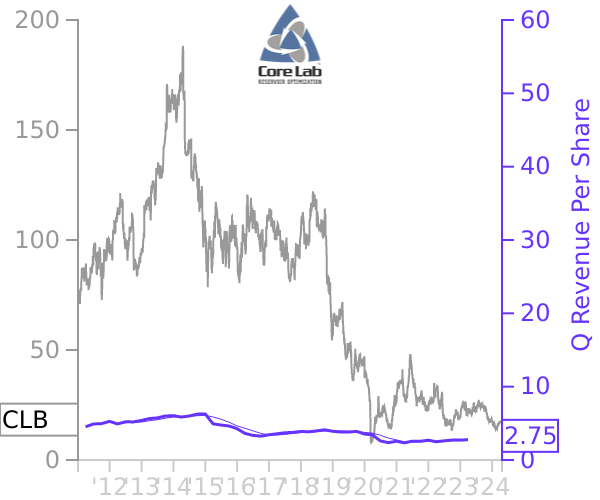
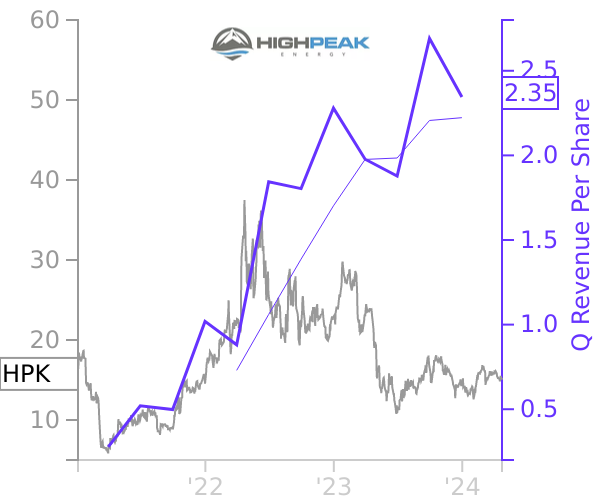
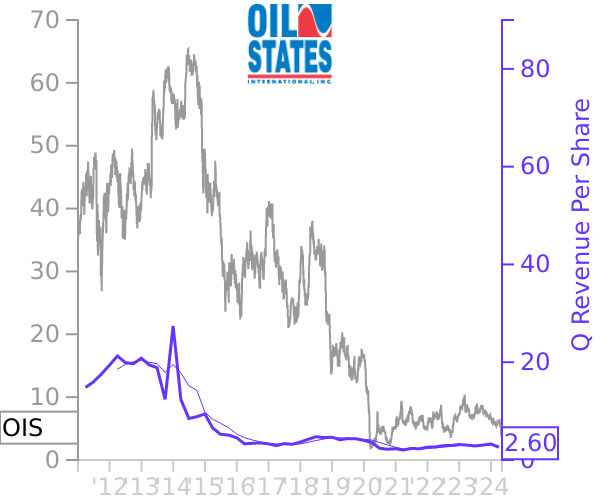
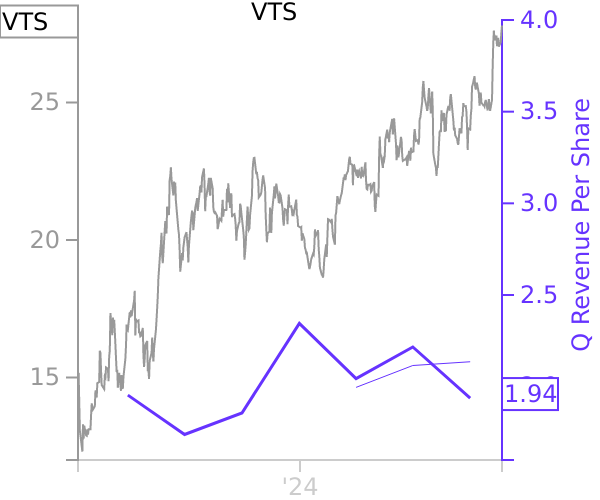
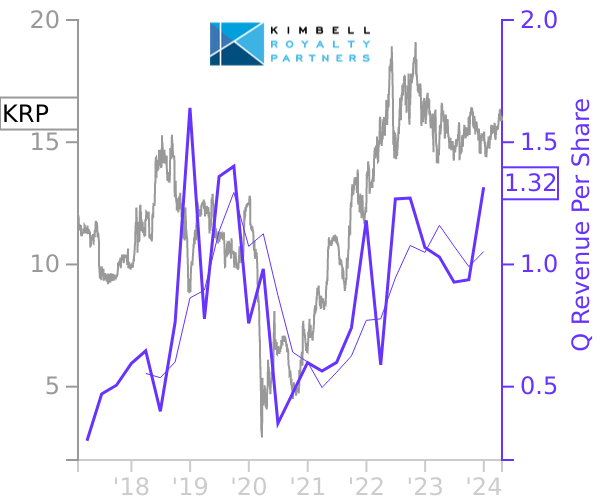
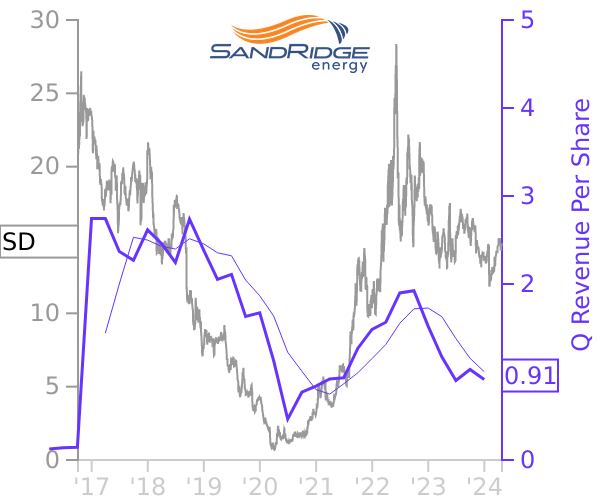
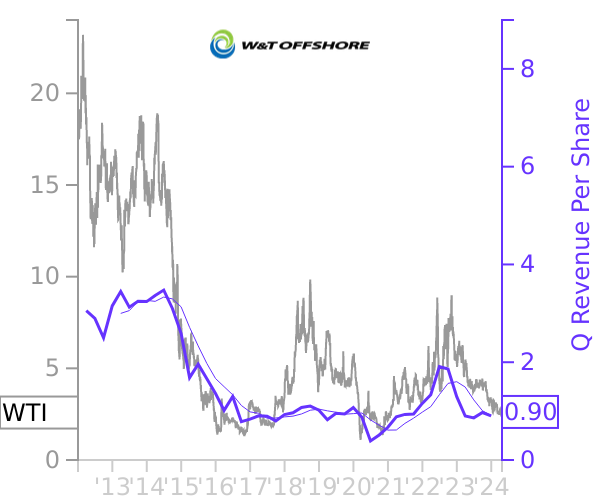
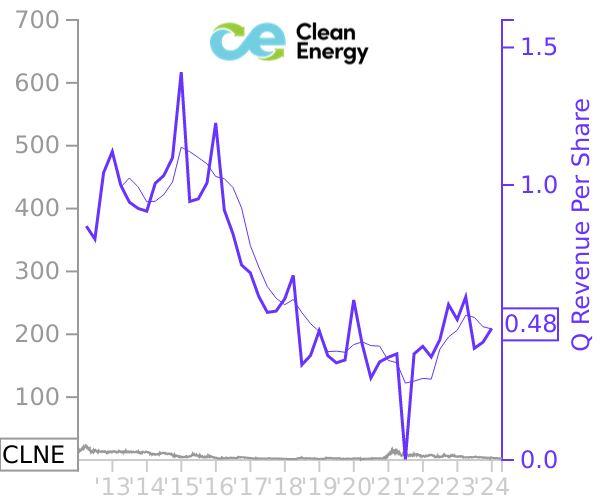
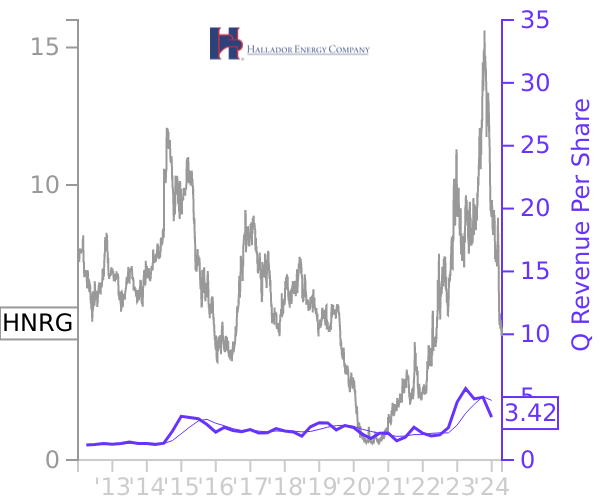
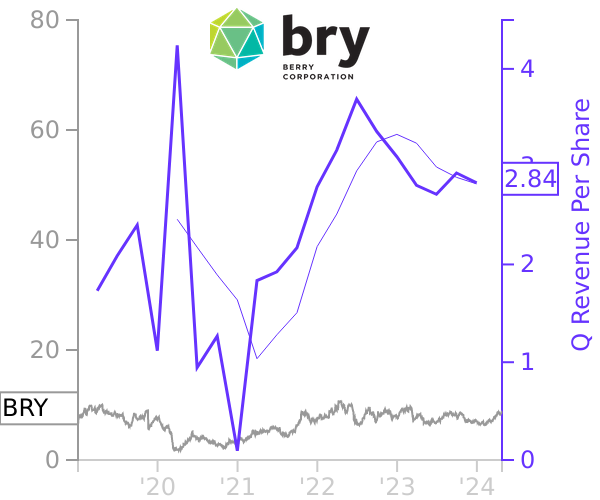
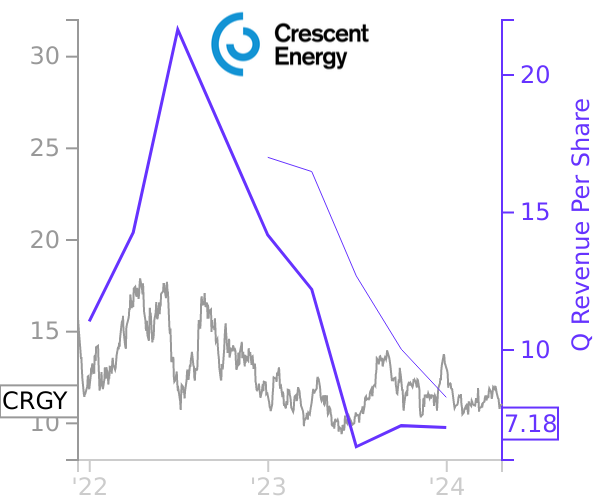
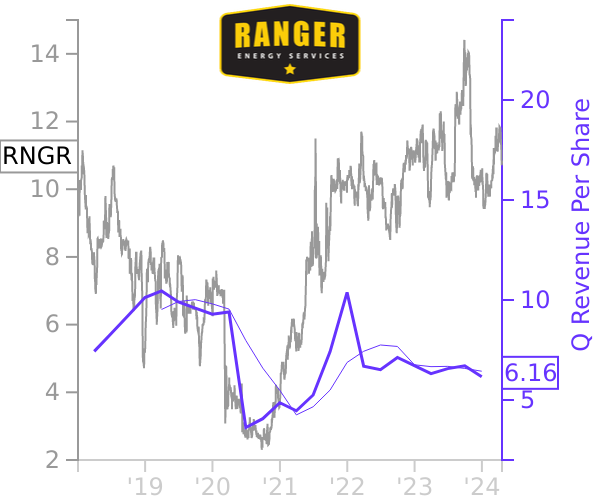
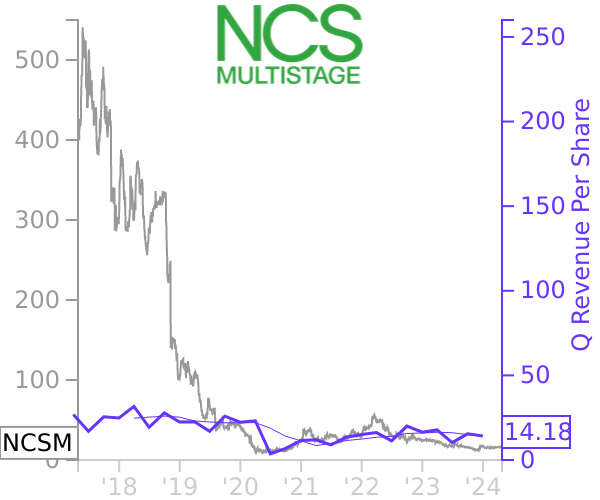
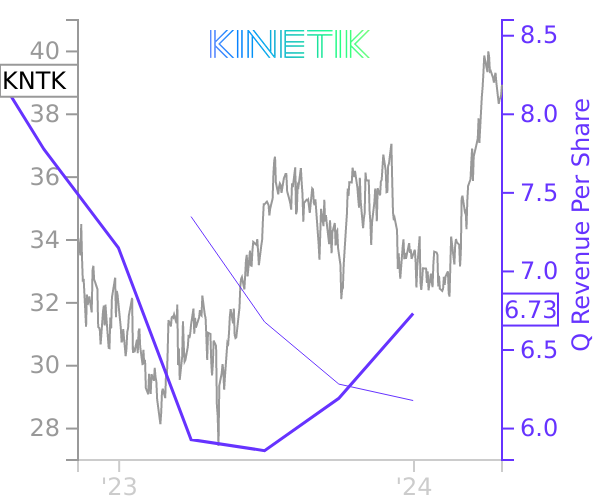
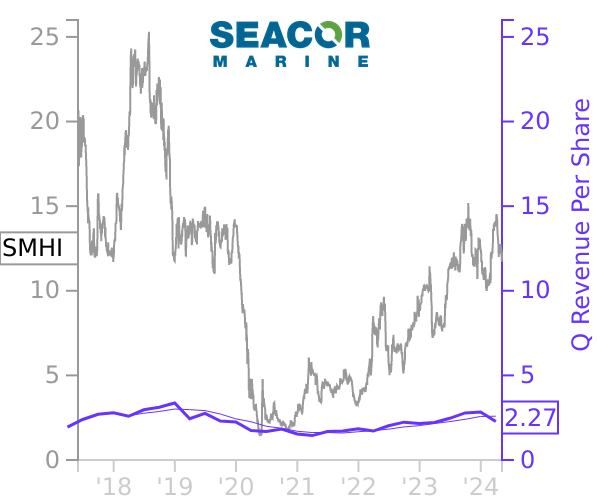
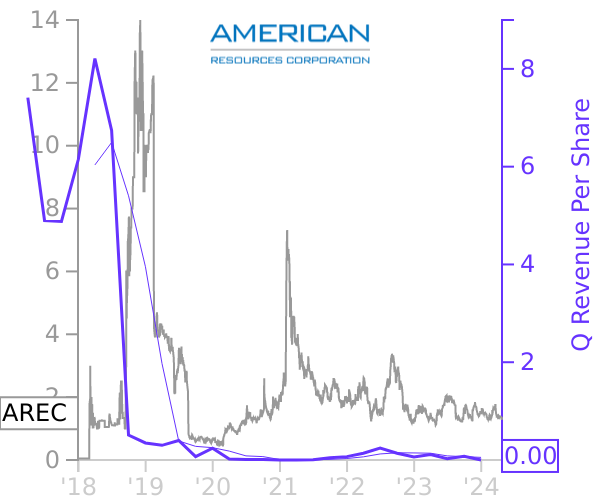
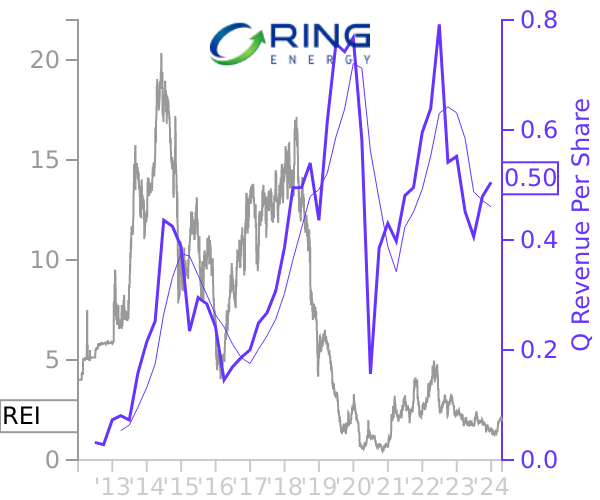
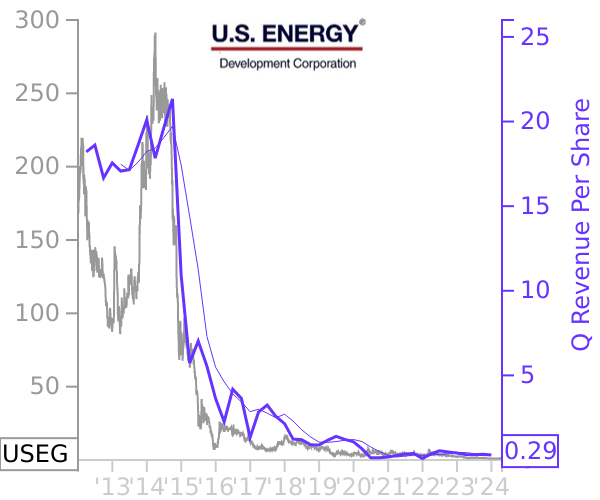
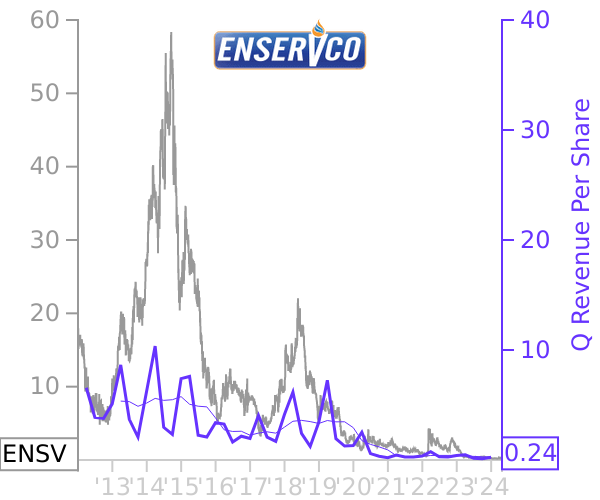
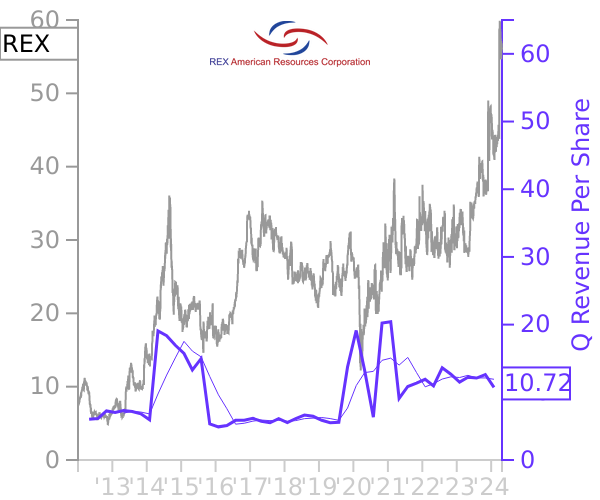
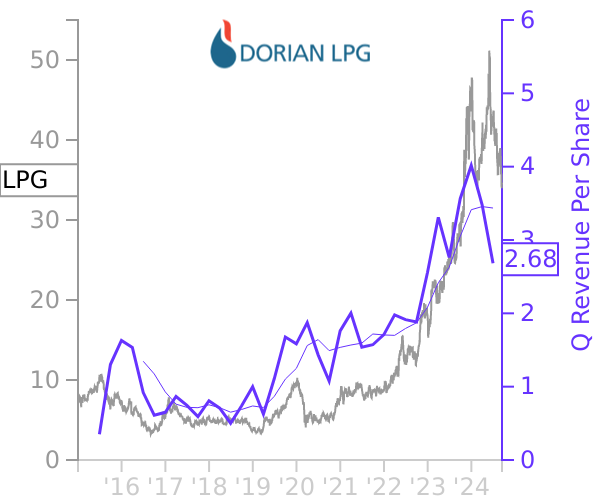
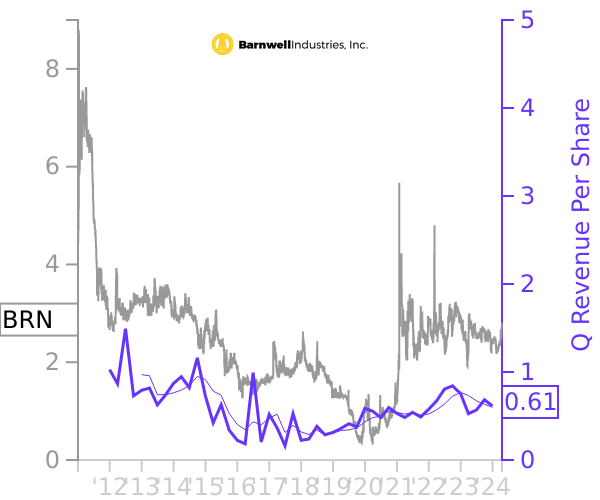
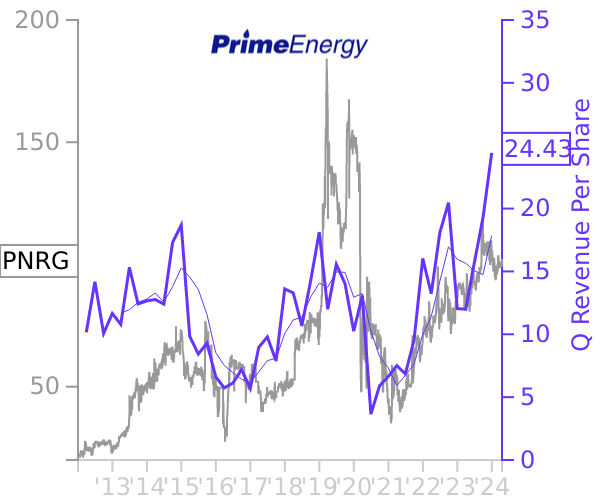
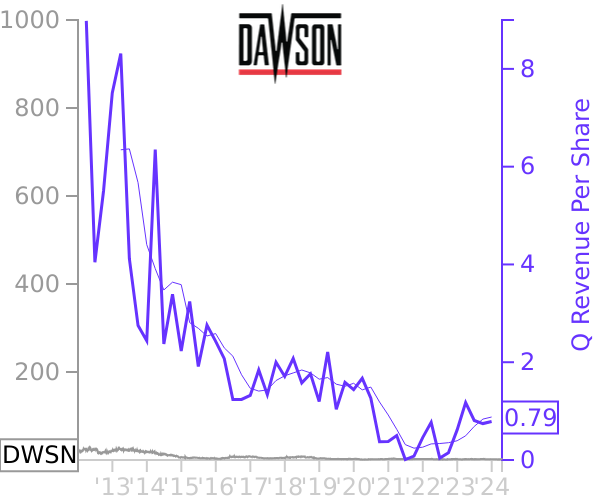
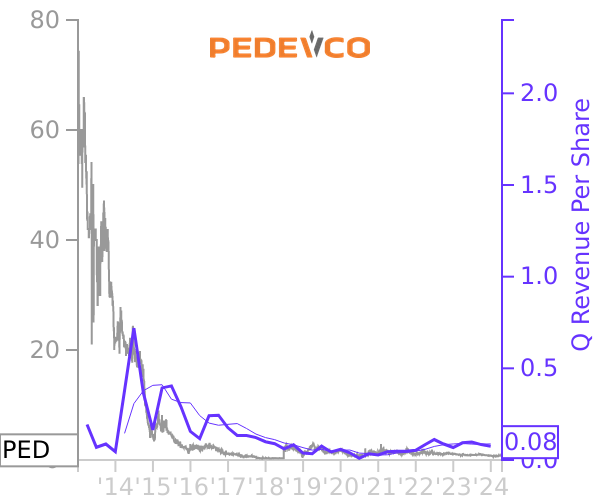
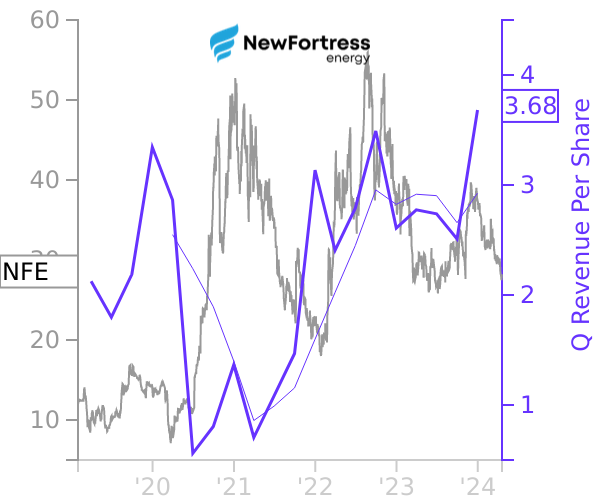
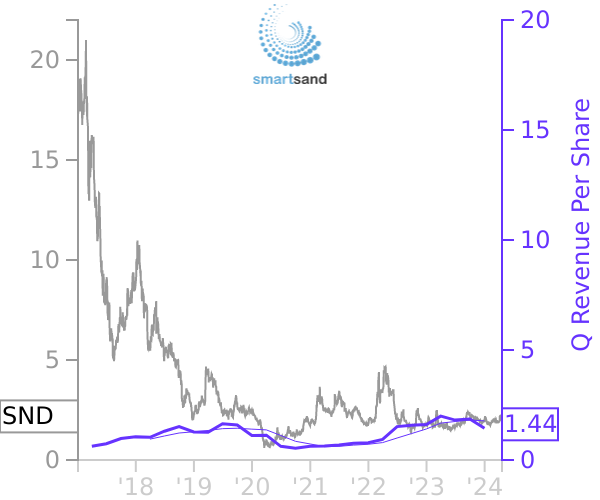
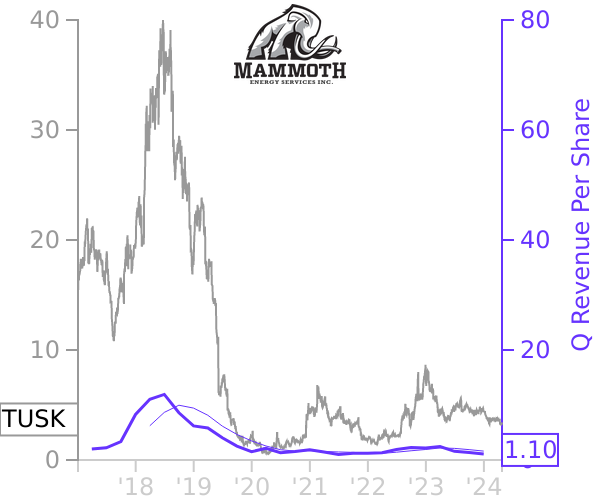
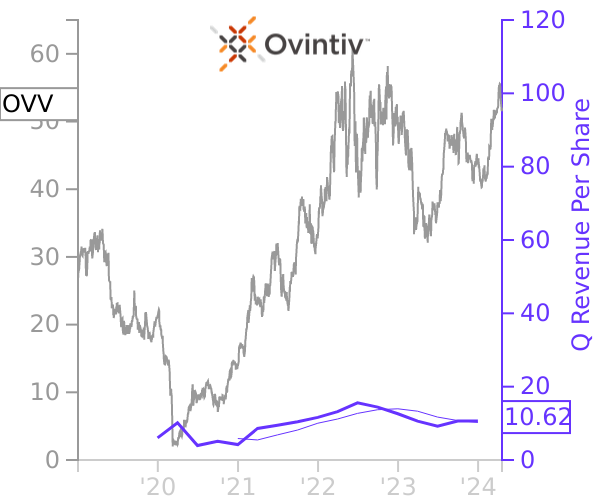
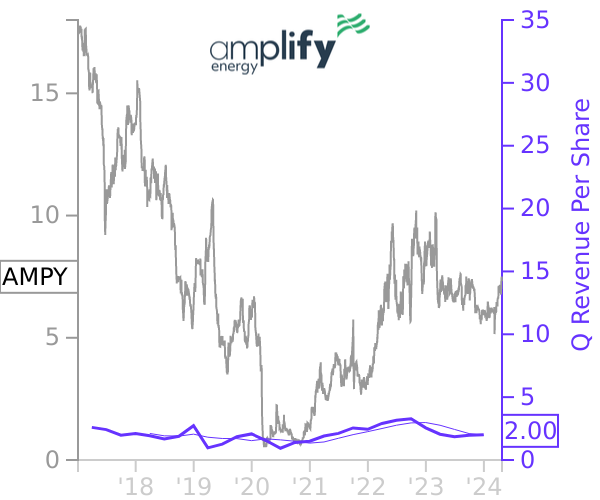
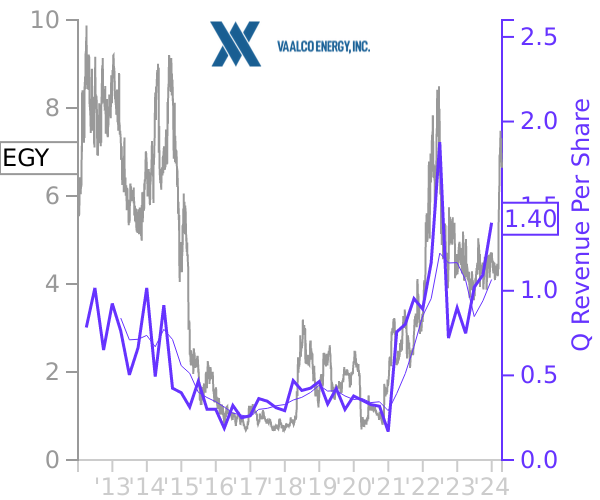
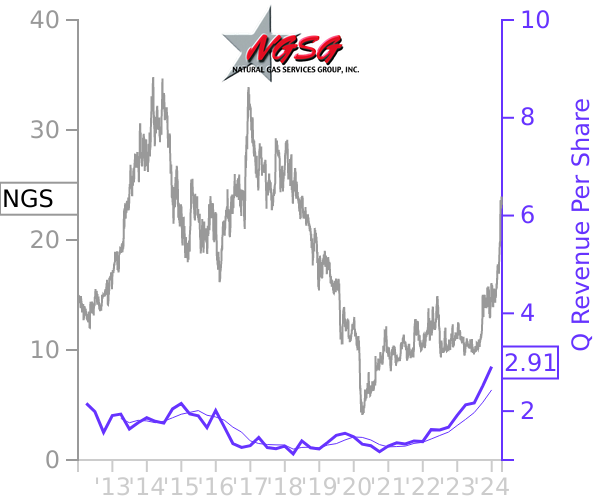
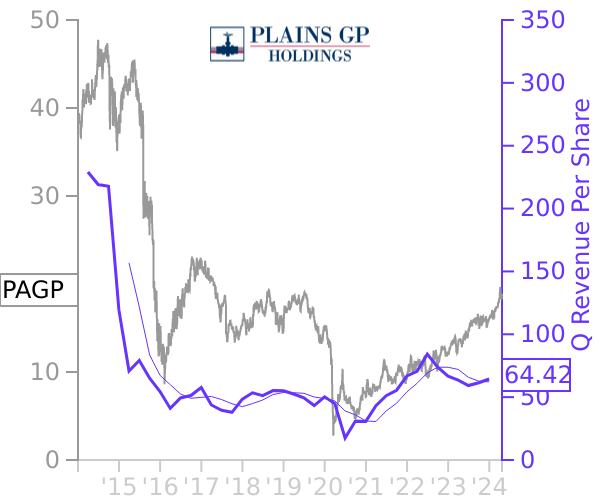
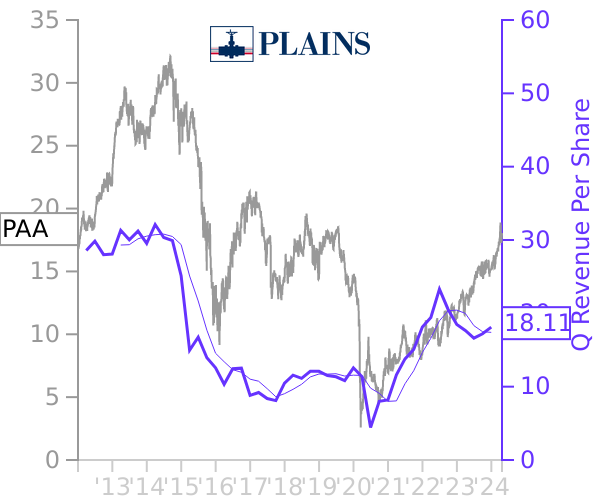
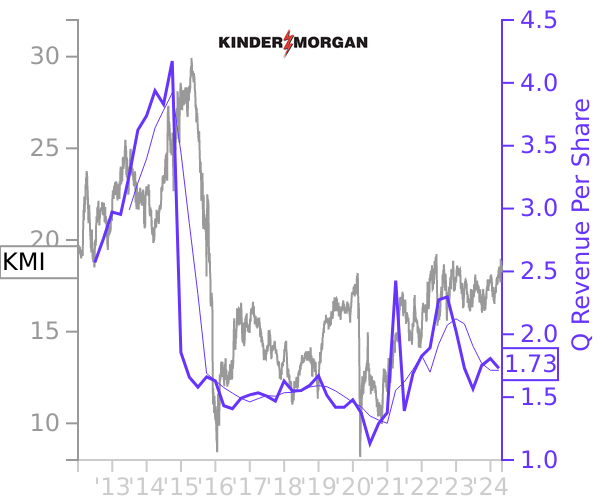
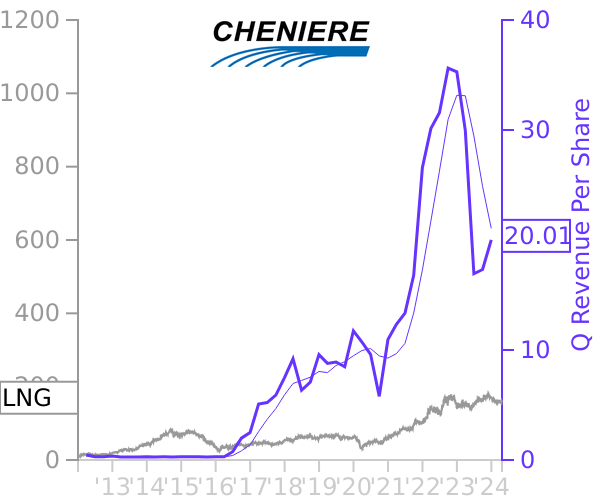
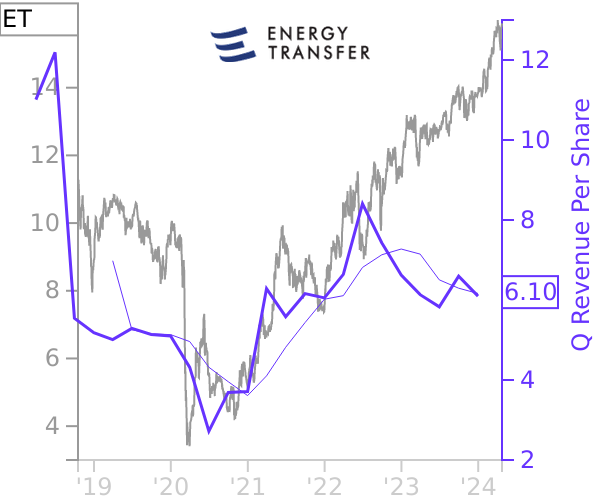
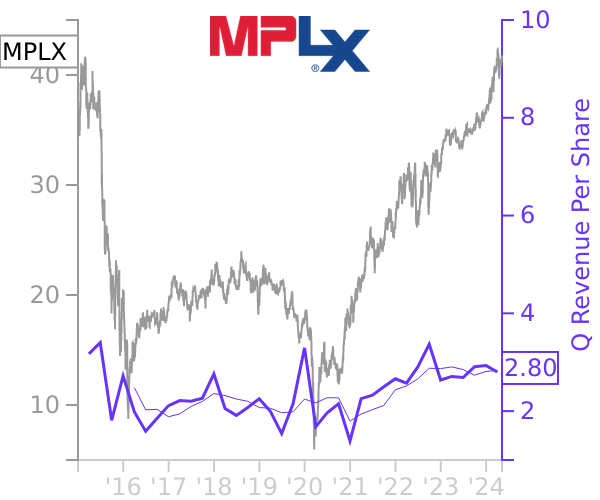
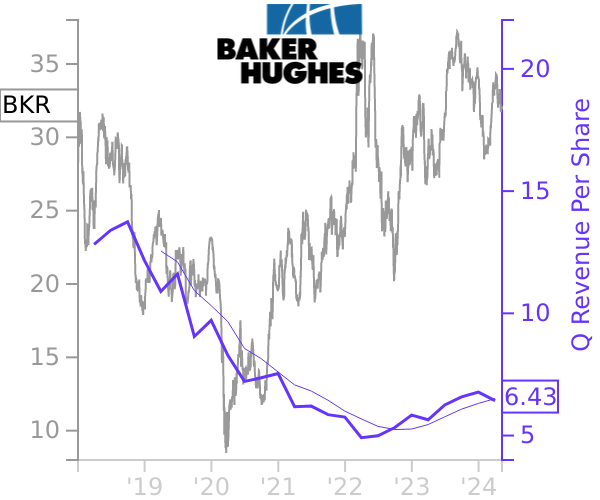
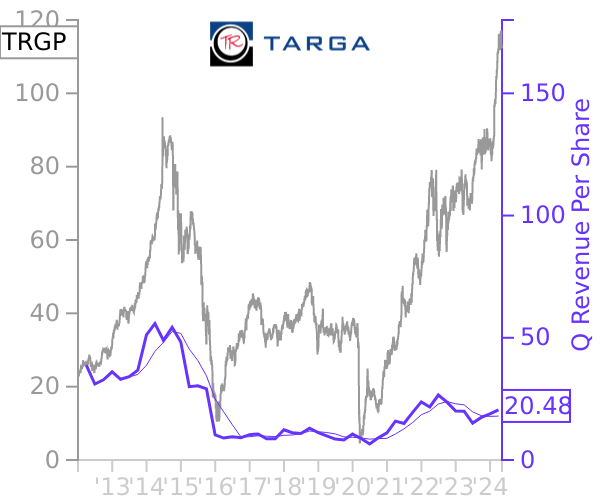
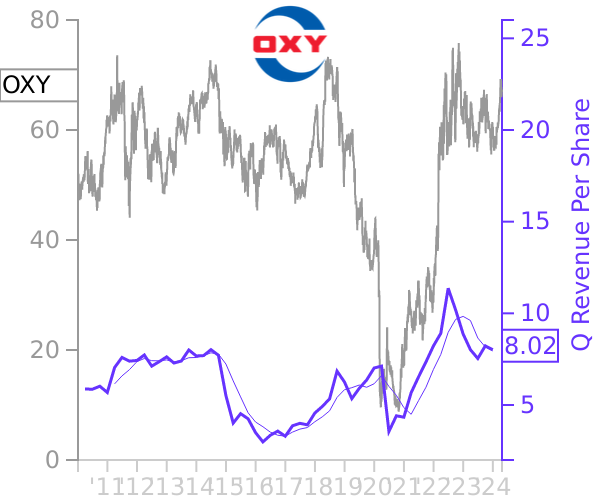
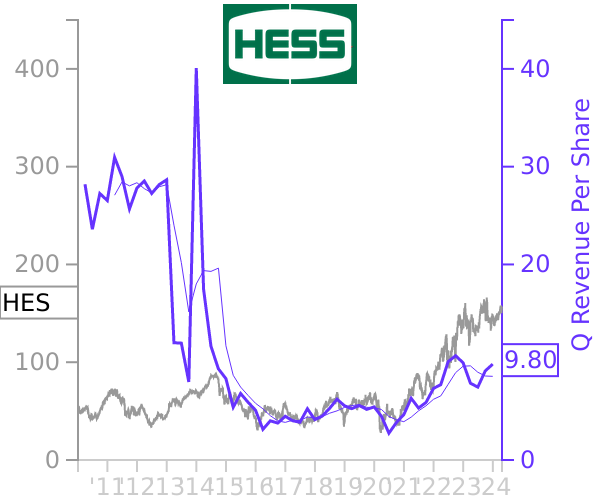
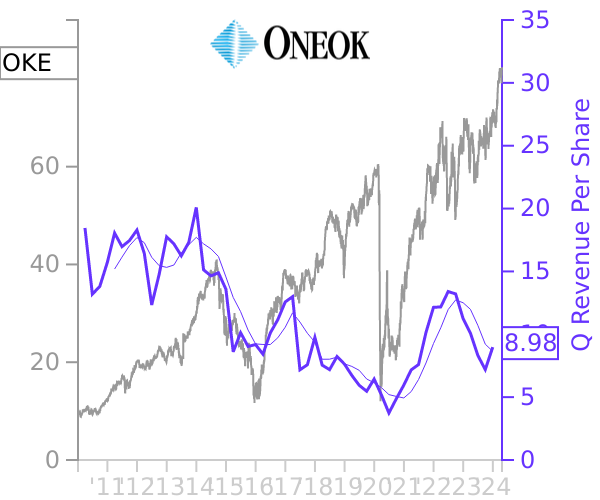
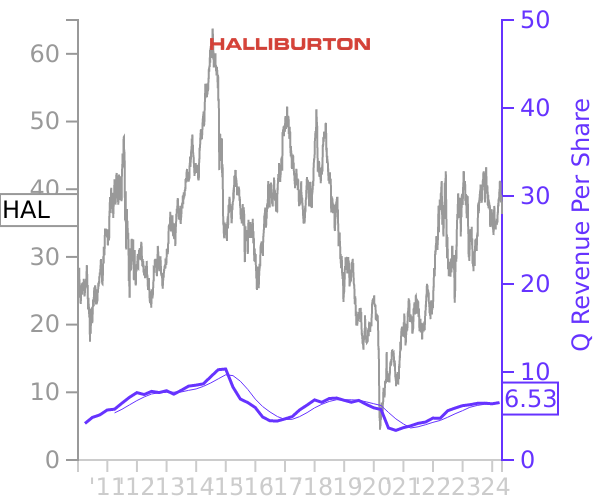
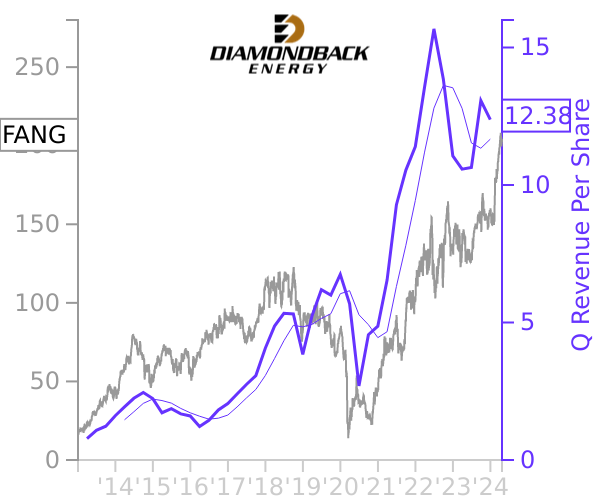
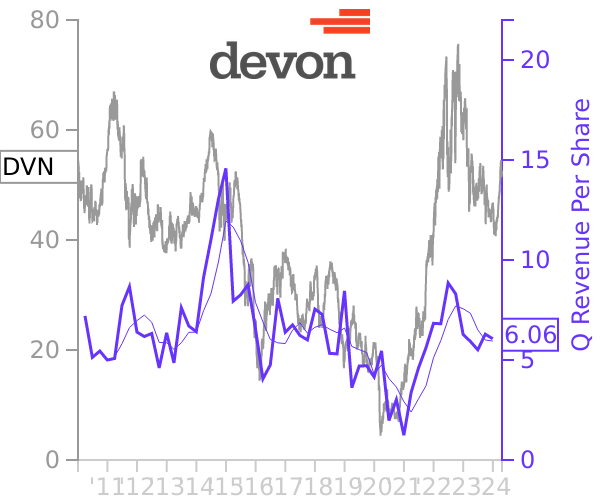
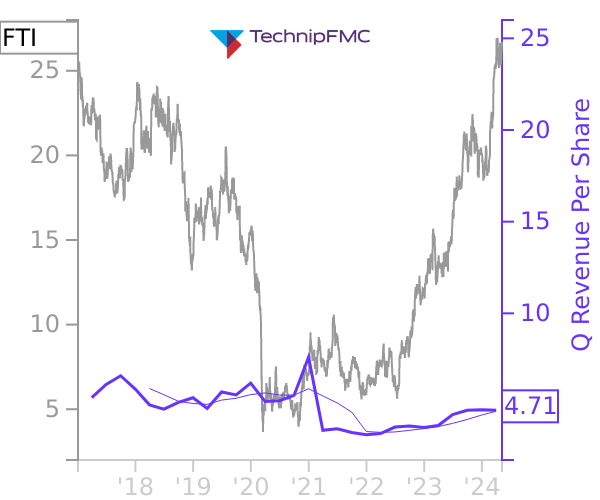
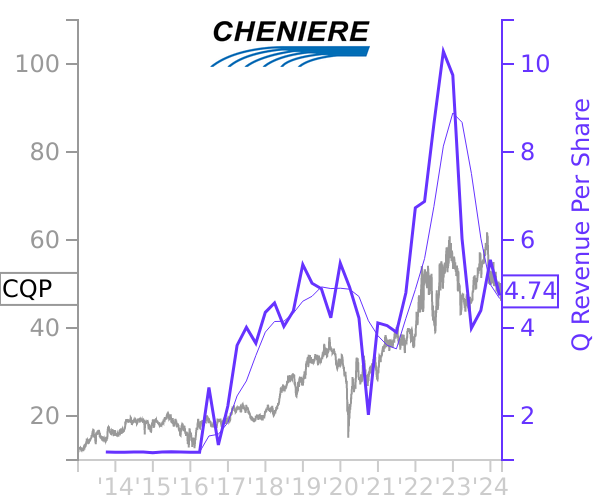
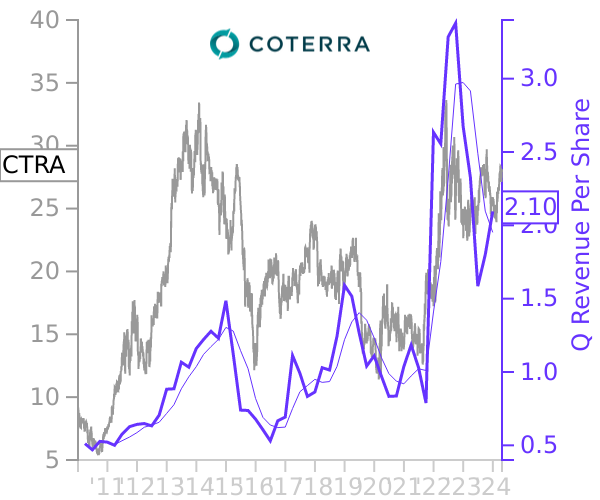
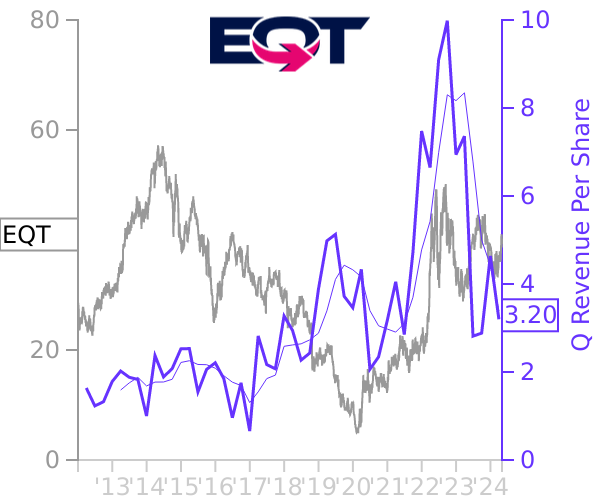
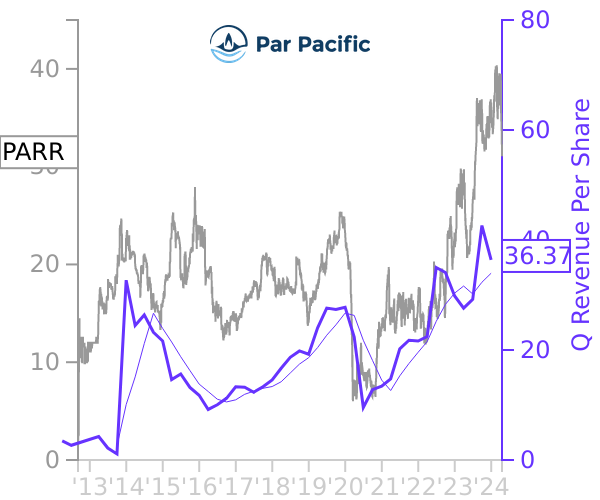
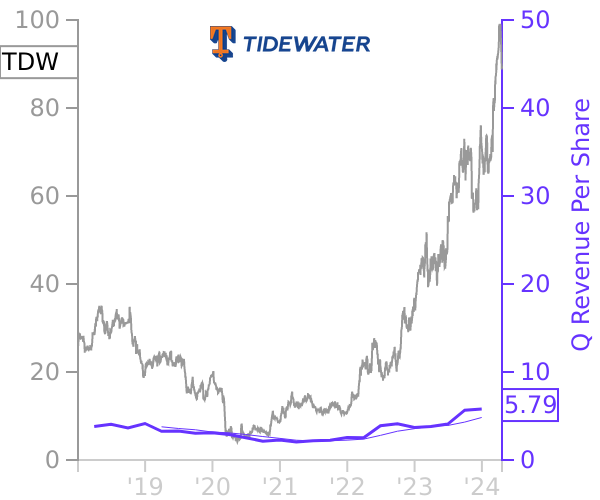
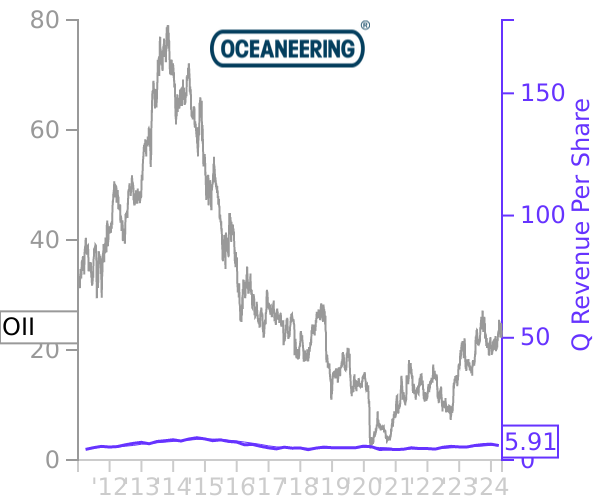
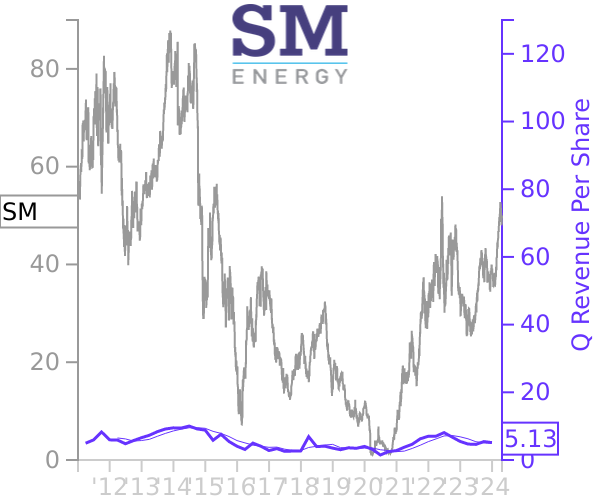
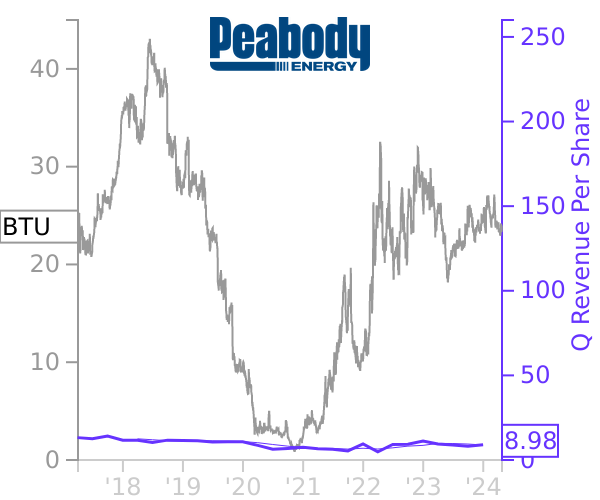
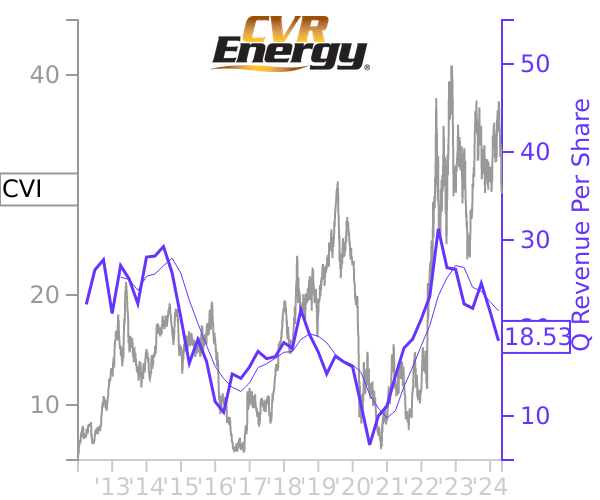
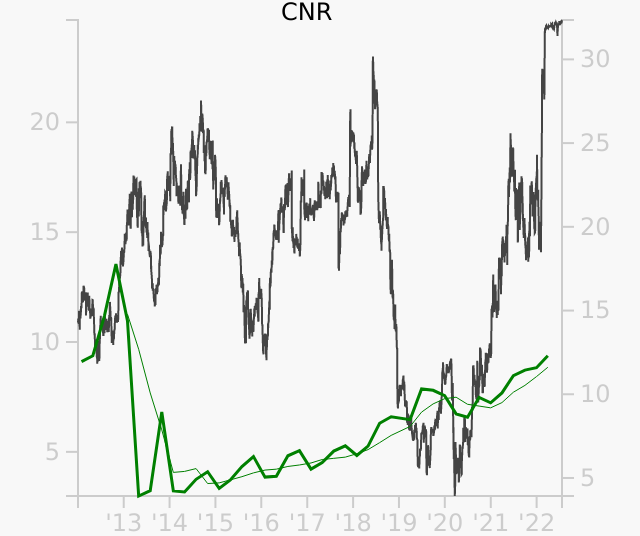
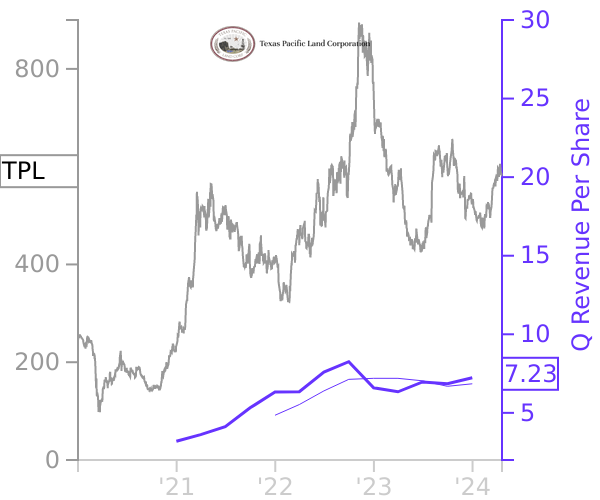
Energy Stock Prices vs Revenue
Quarterly revenue and earnings fluctuate like stock prices. Get the big picture with insights from company insiders and leading investors.
Recent Filings
Largest Companies
Insider Buying
Recent Energy Filings
Largest Market Caps
Refining
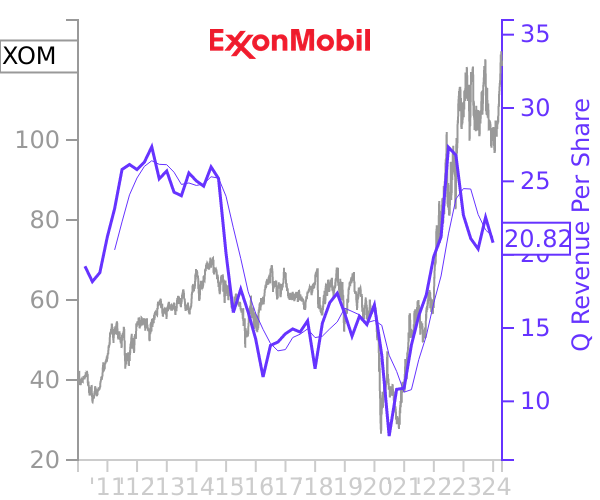
Exxon Mobil
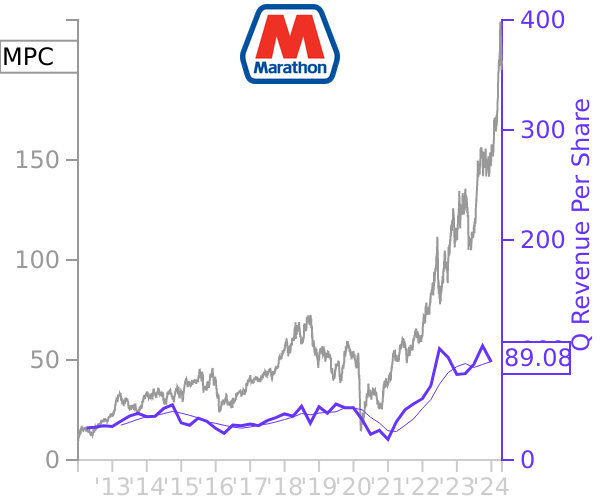
Refining
Marathon Petroleum
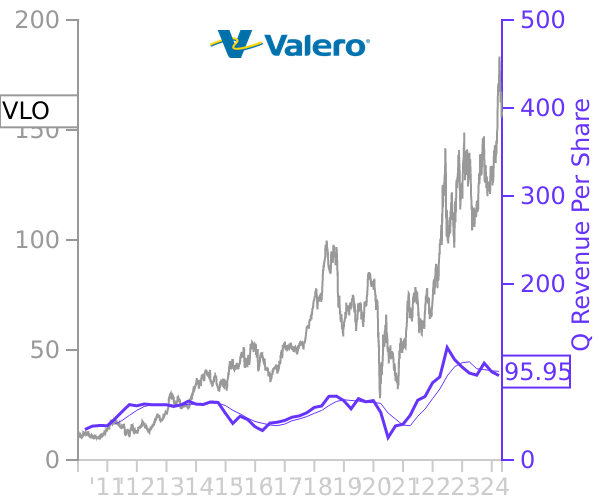
Refining
Valero Energy
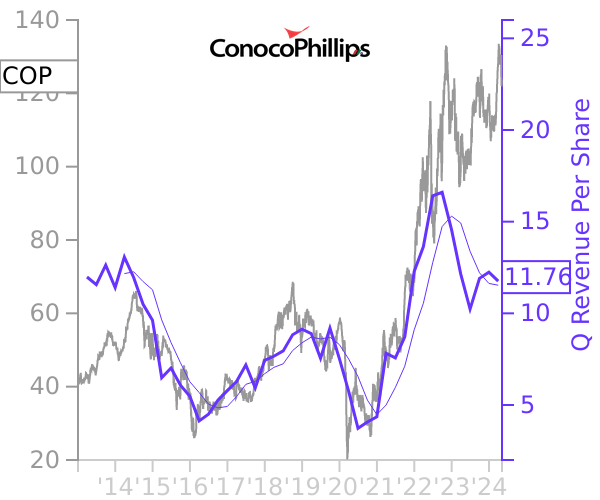
Refining
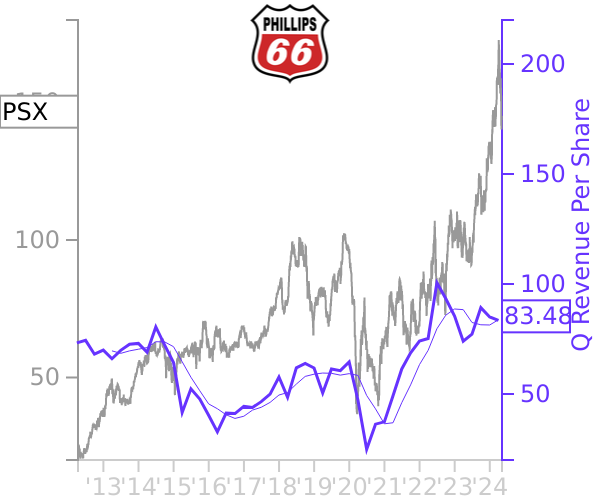
Phillips 66

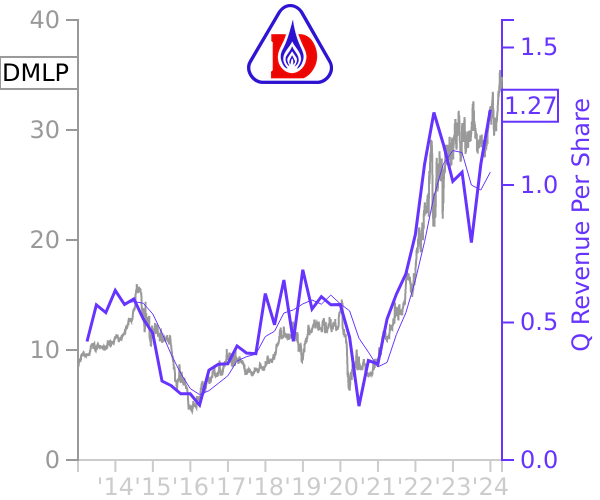
Energy Royalties
Dorchester Minerals
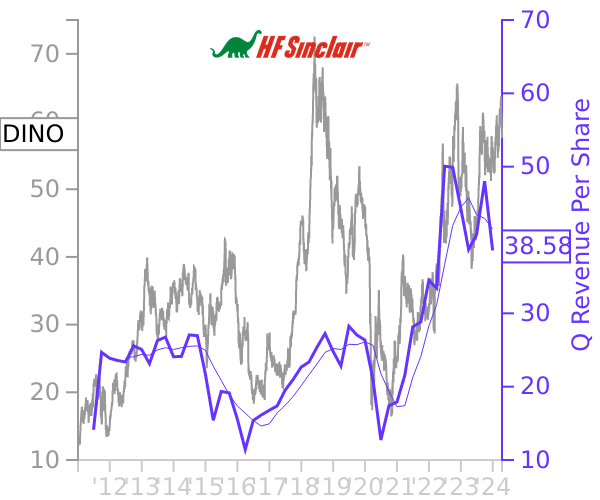
Refining
HF Sinclair
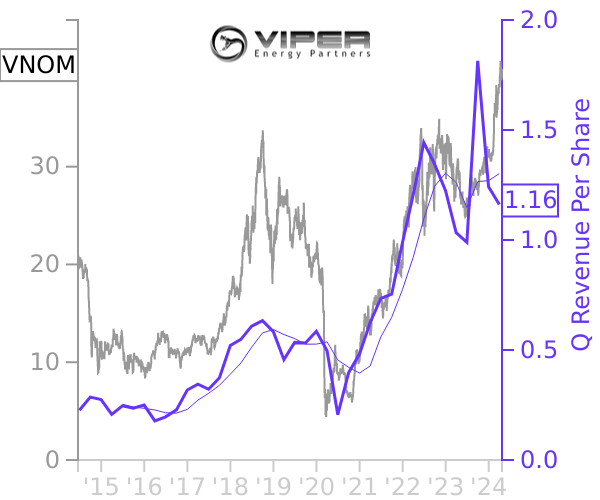
Energy Royalties
Viper Energy

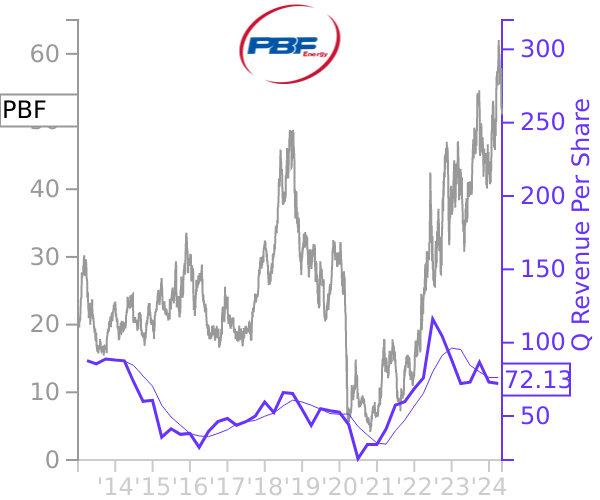
Refining
PBF Energy
Energy Royalties
Texas Pacific Land
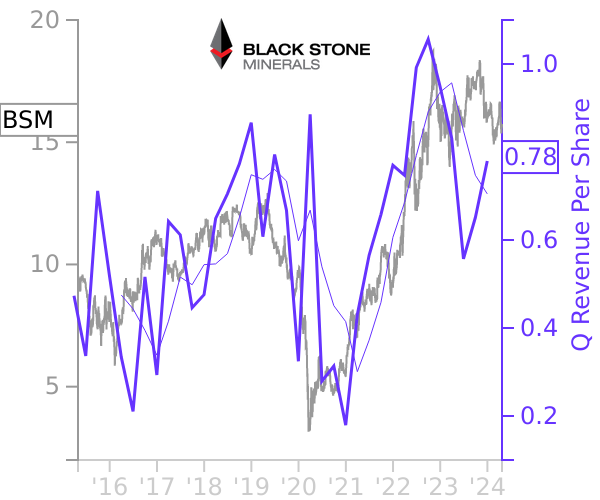
Energy Royalties
Black Stone Minerals