Industrials › Wholesale-Machinery, Equipment And Supplies

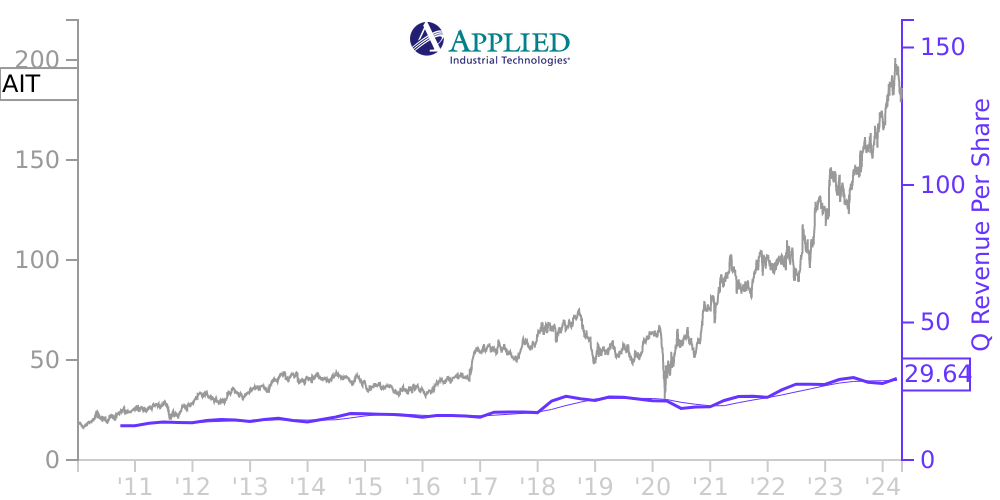
AIT Stock Price Correlated With Applied Industrial Technologies Financials
External Links ⌄
Income Statement
Cash Flow
Balance Sheet
AIT Income Statement
Enable JavaScript and reload
Revenue, Net:
Cost of Goods & Services Sold:
Gross Profit:
Selling, General & Admin Expense:
Research & Development Expense:
Total Operating Expenses:
Operating Income:
Income Taxes:
Net Income:
AIT Cash Flow
Enable JavaScript and reload
Operating Activities Net Income:
Depreciation, Depletion & Amortization:
Change in Accounts Receiveable:
Net Cash from Operations:
Repurchases/Buybacks Common Stock:
Issuance of Long-term Debt:
Cash Dividends Paid:
Net Cash from Financing Activities:
Property, Plant & Equipment Purchases:
Purchases of Businesses, Net of Cash:
Net Cash from Investing Activities:
Net Change in Cash & Equivalents:
AIT Balance Sheet
Enable JavaScript and reload
Cash and Cash Equivalents:
Short-Term Investments:
Accounts Receivable, Net:
Inventories:
Total Current Assets:
Property, Plant & Equipment, Net:
Total Assets:
Accounts Payable:
Current Portion of Long-Term Debt:
Total Short-Term Liabilities:
Long Term Debt, Non-Current Portion:
Total Long-Term Liabilities:
Total Liabilities:
COMPANY PROFILE
BASIS OF PRESENTATION The accompanying unaudited condensed consolidated financial statements have been prepared in accordance with accounting principles generally accepted in the United States of America for interim financial information and with the instructions to Form 10-Q and Regulation S-X. Accordingly, they do not include all of the information and footnotes required by accounting principles generally accepted in the United States of America for complete financial statements. In the opinion of management, all adjustments (consisting of normal recurring adjustments) considered necessary for a fair presentation of the financial position of Applied Industrial Technologies, Inc. (the “Company”, or “Applied”) as of March 31, 2022, and the results of its operations and its cash flows for the nine month periods ended March 31, 2022 and 2021, have been included. The condensed consolidated balance sheet as of June 30, 2021 has been derived from the audited consolidated financial statements at that date. This Quarterly Report on Form 10-Q should be read in conjunction with the Company’s Annual Report on Form 10-K for the year ended June 30, 2021.
Operating results for the nine month period ended March 31, 2022 are not necessarily indicative of the results that may be expected for the remainder of the fiscal year ending June 30, 2022.
Inventory
The Company uses the LIFO method of valuing U.S. inventories. An actual valuation of inventory under the LIFO method can be made only at the end of each year based on the inventory levels and costs at that time. Accordingly, interim LIFO calculations are based on management’s estimates of expected year-end inventory levels and costs and are subject to the final year-end LIFO inventory determination. LIFO expense of $7,397 and $781 in the three months ended March 31, 2022 and 2021, respectively, and $15,643 and $2,777 in the nine months ended March 31, 2022 and 2021, respectively, is recorded in cost of sales in the condensed statements of consolidated income.
Free historical financial statements for Applied Industrial Technologies in. See how revenue, income, cash flow, and balance sheet financials have changed over 63 quarters since 2010. Compare with AIT stock chart to see long term trends.
Data imported from Applied Industrial Technologies in SEC filings. Check original filings before making any investment decision.