Technology › Services-Business Services, Nec

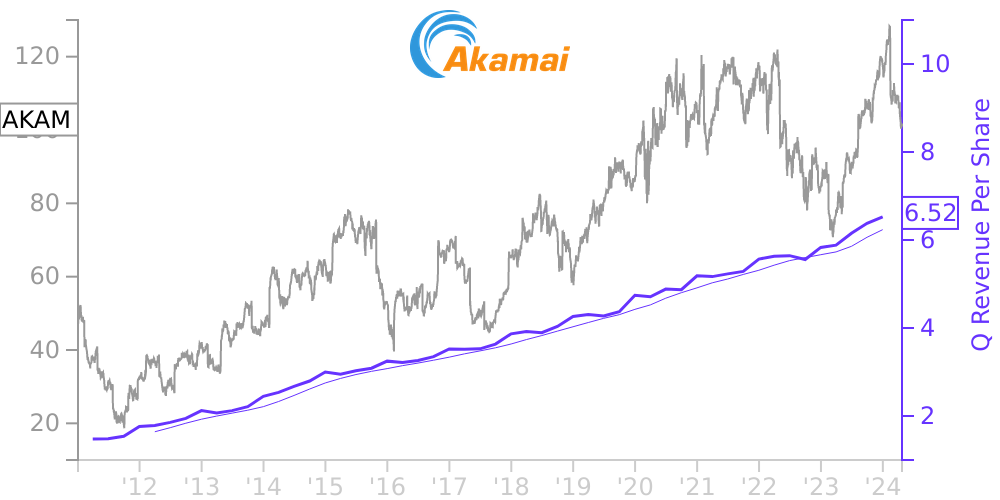
AKAM Stock Price Correlated With Akamai Technologies Financials
External Links ⌄
Income Statement
Cash Flow
Balance Sheet
AKAM Income Statement
Enable JavaScript and reload
Revenue, Net:
Cost of Goods & Services Sold:
Gross Profit:
Selling, General & Admin Expense:
Research & Development Expense:
Total Operating Expenses:
Operating Income:
Income Taxes:
Net Income:
AKAM Cash Flow
Enable JavaScript and reload
Operating Activities Net Income:
Depreciation, Depletion & Amortization:
Change in Accounts Receiveable:
Net Cash from Operations:
Repurchases/Buybacks Common Stock:
Issuance of Long-term Debt:
Cash Dividends Paid:
Net Cash from Financing Activities:
Property, Plant & Equipment Purchases:
Purchases of Businesses, Net of Cash:
Net Cash from Investing Activities:
Net Change in Cash & Equivalents:
AKAM Balance Sheet
Enable JavaScript and reload
Cash and Cash Equivalents:
Short-Term Investments:
Accounts Receivable, Net:
Inventories:
Total Current Assets:
Property, Plant & Equipment, Net:
Total Assets:
Accounts Payable:
Current Portion of Long-Term Debt:
Total Short-Term Liabilities:
Long Term Debt, Non-Current Portion:
Total Long-Term Liabilities:
Total Liabilities:
COMPANY PROFILE
Nature of Business and Basis of Presentation Akamai Technologies, Inc. (the “Company”) provides solutions to power and protect digital experiences. Its globally-distributed platform comprises more than 350,000 servers across more than 130 countries. The Company was incorporated in Delaware in 1998 and is headquartered in Cambridge, Massachusetts. The Company is currently organized and operates as one reportable and operating segment: providing solutions to power and protect digital experiences.
The accompanying consolidated financial statements include the accounts of the Company and its wholly-owned subsidiaries. All intercompany transactions and balances have been eliminated in the accompanying consolidated financial statements.
The accompanying consolidated financial statements include the accounts of the Company and its wholly-owned subsidiaries. All intercompany transactions and balances have been eliminated in the accompanying consolidated financial statements.
Free historical financial statements for Akamai Technologies Inc. See how revenue, income, cash flow, and balance sheet financials have changed over 61 quarters since 2011. Compare with AKAM stock chart to see long term trends.
Data imported from Akamai Technologies Inc SEC filings. Check original filings before making any investment decision.