Industrials › Farm Machinery And Equipment

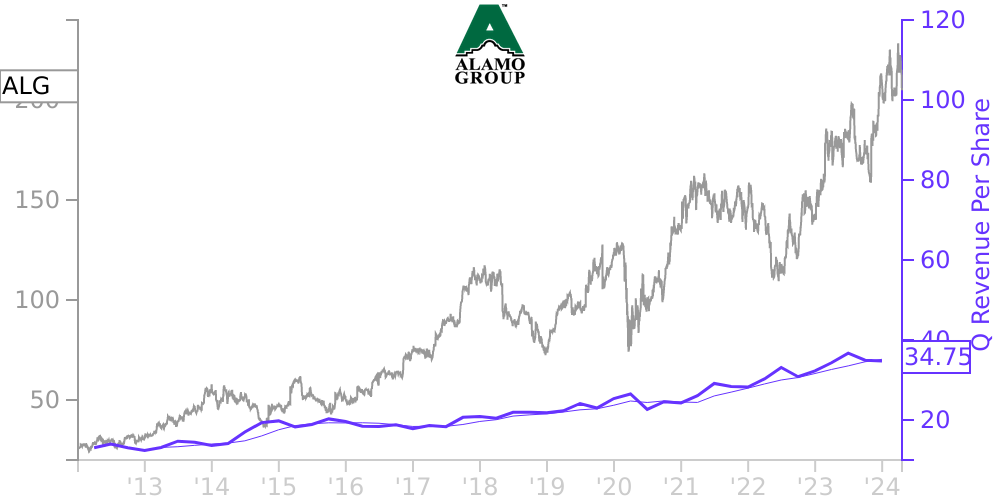
ALG Stock Price Correlated With Alamo Financials
External Links ⌄
Income Statement
Cash Flow
Balance Sheet
ALG Income Statement
Enable JavaScript and reload
Revenue, Net:
Cost of Goods & Services Sold:
Gross Profit:
Selling, General & Admin Expense:
Research & Development Expense:
Total Operating Expenses:
Operating Income:
Income Taxes:
Net Income:
ALG Cash Flow
Enable JavaScript and reload
Operating Activities Net Income:
Depreciation, Depletion & Amortization:
Change in Accounts Receiveable:
Net Cash from Operations:
Repurchases/Buybacks Common Stock:
Issuance of Long-term Debt:
Cash Dividends Paid:
Net Cash from Financing Activities:
Property, Plant & Equipment Purchases:
Purchases of Businesses, Net of Cash:
Net Cash from Investing Activities:
Net Change in Cash & Equivalents:
ALG Balance Sheet
Enable JavaScript and reload
Cash and Cash Equivalents:
Short-Term Investments:
Accounts Receivable, Net:
Inventories:
Total Current Assets:
Property, Plant & Equipment, Net:
Total Assets:
Accounts Payable:
Current Portion of Long-Term Debt:
Total Short-Term Liabilities:
Long Term Debt, Non-Current Portion:
Total Long-Term Liabilities:
Total Liabilities:
COMPANY PROFILE
Basis of Financial Statement Presentation General
The accompanying unaudited interim condensed consolidated financial statements of Alamo Group Inc. and its subsidiaries (the “Company”) have been prepared in accordance with U.S. generally accepted accounting principles (“GAAP”) for interim financial information and with the instructions to Form 10-Q and Article 10 of Regulations S-X. Accordingly, they do not include all of the information and footnotes required by U.S. GAAP for complete financial statements. In the opinion of management, all adjustments (consisting of normal recurring accruals) considered necessary for a fair presentation have been included. Operating results for the periods presented are not necessarily indicative of the results that may be expected for the year ending December 31, 2022. The balance sheet at December 31, 2021 has been derived from the audited financial statements at that date but does not include all of the information and footnotes required by U.S. GAAP for complete financial statements. For further information, refer to the consolidated financial statements and footnotes thereto included in the Company’s annual report on Form 10-K for the year ended December 31, 2021 (the "2021 10-K").
Effective July 1, 2021, the Company changed its method of accounting for its U.S. inventories from last-in, first-out ("LIFO") method to the first-in, first-out ("FIFO") method. The Company applied this change retrospectively for all prior periods presented.
Accounting Pronouncements Not Yet Adopted
In March 2020, the FASB issued ASU No. 2020-04, “Reference Rate Reform (Topic 848): Facilitation of the Effects of Reference Rate Reform on Financial Reporting”. This Topic provides accounting relief for the transition away from LIBOR and certain other reference rates. The amendments for this update are effective through December 31, 2022. The Company is evaluating the impact the adoption of this standard will have on our financial statements.
Free historical financial statements for Alamo Group Inc. See how revenue, income, cash flow, and balance sheet financials have changed over 57 quarters since 2012. Compare with ALG stock chart to see long term trends.
Data imported from Alamo Group Inc SEC filings. Check original filings before making any investment decision.