Consumer Discretionary › Motor Vehicle Parts And Accessories

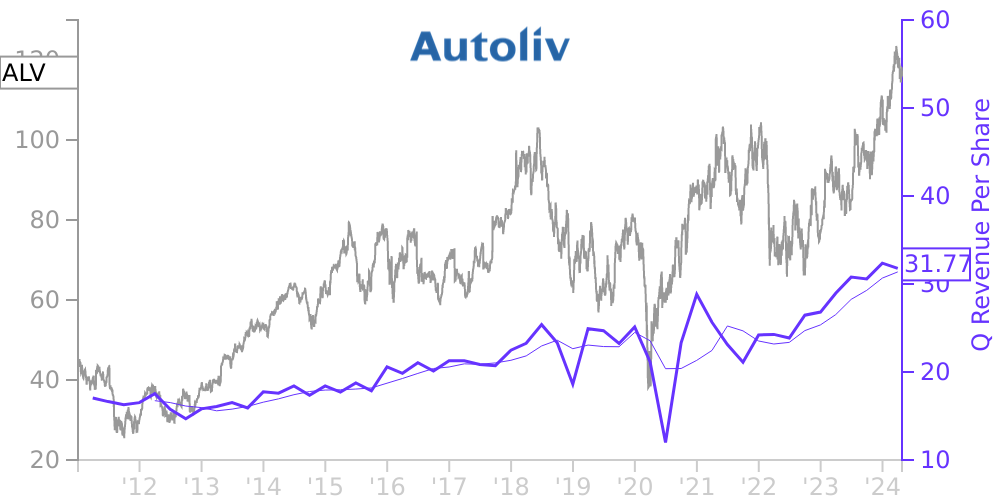
ALV Stock Price Correlated With Autoliv Financials
External Links ⌄
Income Statement
Cash Flow
Balance Sheet
ALV Income Statement
Enable JavaScript and reload
Revenue, Net:
Cost of Goods & Services Sold:
Gross Profit:
Selling, General & Admin Expense:
Research & Development Expense:
Total Operating Expenses:
Operating Income:
Income Taxes:
Net Income:
ALV Cash Flow
Enable JavaScript and reload
Operating Activities Net Income:
Depreciation, Depletion & Amortization:
Change in Accounts Receiveable:
Net Cash from Operations:
Repurchases/Buybacks Common Stock:
Issuance of Long-term Debt:
Cash Dividends Paid:
Net Cash from Financing Activities:
Property, Plant & Equipment Purchases:
Purchases of Businesses, Net of Cash:
Net Cash from Investing Activities:
Net Change in Cash & Equivalents:
ALV Balance Sheet
Enable JavaScript and reload
Cash and Cash Equivalents:
Short-Term Investments:
Accounts Receivable, Net:
Inventories:
Total Current Assets:
Property, Plant & Equipment, Net:
Total Assets:
Accounts Payable:
Current Portion of Long-Term Debt:
Total Short-Term Liabilities:
Long Term Debt, Non-Current Portion:
Total Long-Term Liabilities:
Total Liabilities:
COMPANY PROFILE
1. Basis of Presentation NATURE OF OPERATIONS Through its operating subsidiaries, Autoliv is a leading developer, manufacturer and supplier of safety systems to the automotive industry. The Company has a broad range of product offerings, primarily passive safety systems, including modules and components for passenger and driver airbags, side airbags, curtain airbags, seatbelts and steering wheels. The Company is also a supplier of anti-whiplash systems and pedestrian protection systems. PRINCIPLES OF CONSOLIDATION The consolidated financial statements have been prepared in accordance with United States (U.S.) Generally Accepted Accounting Principles (GAAP) and include Autoliv, Inc. and all companies over which Autoliv, Inc. directly or indirectly exercises control, which as a general rule means that the Company owns more than 50 % of the voting rights. Consolidation is also required when the Company has both the power to direct the activities of a variable interest entity (VIE) and the obligation to absorb losses or the right to receive benefits from the VIE that could be significant to the VIE. All intercompany accounts and transactions within the Company have been eliminated from the consolidated financial statements. Investments in affiliated companies in which the Company exercises significant influence over the operations and financial policies, but does not control, are reported using the equity method of accounting. Generally, the Company owns between 20 - 50 % of such investments.
SEGMENT REPORTING In accordance with ASC 280, Segment Reporting , the operating segments are determined based on the information provided to the Chief Operating Decision Maker (CODM) on a regular basis and used for the purpose of assessing performance and allocating resources within the Company. The CEO is deemed to be the CODM of Autoliv since he is the person who makes all major decisions on how to allocate the resources and assess the performance of the Company for both strategic and operational initiatives. ASC 280 indicates that a component is an operating segment if it meets the following criteria: • It engages in business activities from which it may earn revenues and incur expenses.
• Its operating results are regularly reviewed by the CODM to make decisions about resources to be allocated to the segment and assess its performance.
• Its discrete financial information is available.
The Company as a whole has met the definition of an operating segment as it engages in business activities from which it may earn revenues and incur expenses, the consolidated operating results are regularly reviewed by the CEO/CODM to allocate resources and assess performance, and discrete financial information is available. Additionally, as Autoliv supplies customers on a global basis it also manages the business on a global basis. Therefore, based on the above analysis, the Company has concluded that the Company is the single operating and reportable segment under ASC 280, Segment Reporting . For more information on the Company's segment, see Note 20. RECLASSIFICATIONS AND ROUNDINGS Certain prior-year amounts have been reclassified to conform to current year presentation.
Certain amounts in the consolidated financial statements and associated notes may not reconcile due to rounding. All percentages have been calculated using unrounded amounts.
Free historical financial statements for Autoliv Inc. See how revenue, income, cash flow, and balance sheet financials have changed over 62 quarters since 2011. Compare with ALV stock chart to see long term trends.
Data imported from Autoliv Inc SEC filings. Check original filings before making any investment decision.