Materials › Miscellaneous Manufacturing Industries

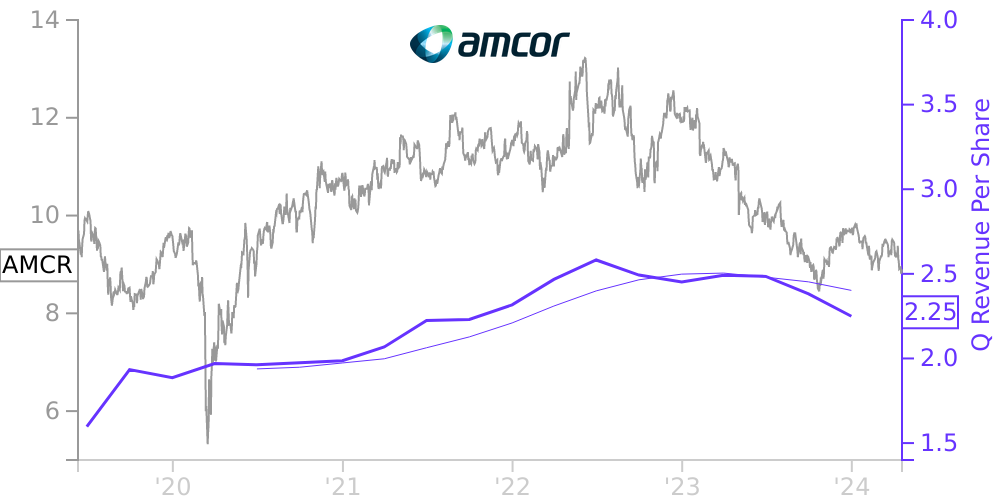
AMCR Stock Price Correlated With Amcor Financials
External Links ⌄
Income Statement
Cash Flow
Balance Sheet
AMCR Income Statement
Enable JavaScript and reload
Revenue, Net:
Cost of Goods & Services Sold:
Gross Profit:
Selling, General & Admin Expense:
Research & Development Expense:
Total Operating Expenses:
Operating Income:
Income Taxes:
Net Income:
AMCR Cash Flow
Enable JavaScript and reload
Operating Activities Net Income:
Depreciation, Depletion & Amortization:
Change in Accounts Receiveable:
Net Cash from Operations:
Repurchases/Buybacks Common Stock:
Issuance of Long-term Debt:
Cash Dividends Paid:
Net Cash from Financing Activities:
Property, Plant & Equipment Purchases:
Purchases of Businesses, Net of Cash:
Net Cash from Investing Activities:
Net Change in Cash & Equivalents:
AMCR Balance Sheet
Enable JavaScript and reload
Cash and Cash Equivalents:
Short-Term Investments:
Accounts Receivable, Net:
Inventories:
Total Current Assets:
Property, Plant & Equipment, Net:
Total Assets:
Accounts Payable:
Current Portion of Long-Term Debt:
Total Short-Term Liabilities:
Long Term Debt, Non-Current Portion:
Total Long-Term Liabilities:
Total Liabilities:
COMPANY PROFILE
Business Description Amcor plc ("Amcor" or the "Company") is a holding company originally incorporated under the name Arctic Jersey Limited as a limited company incorporated under the Laws of the Bailiwick of Jersey in July 2018, in order to effect the Company's combination with Bemis Company, Inc. On October 10, 2018, Arctic Jersey Limited was renamed "Amcor plc" and became a public limited company incorporated under the Laws of the Bailiwick of Jersey. On June 11, 2019, the Company completed its acquisition of Bemis Company, Inc ("Bemis"). The combination of Amcor and Bemis has created a global packaging leader. See Note 4, "Acquisitions and Divestitures," for more information on the Bemis acquisition.
The Company develops and produces a broad range of packaging products including flexible packaging, rigid packaging containers, specialty cartons, and closures. The Company employs approximately 46,000 individuals and has 225 significant manufacturing and support facilities in more than 40 countries.
The Company's business activities are organized around two reportable segments, Flexibles and Rigid Packaging. The Company has a globally diverse operating footprint, selling to customers in Europe, North America, Latin America, Africa, and the Asia Pacific regions. The Company's sales are widely diversified, with the majority of sales made to the food, beverage, pharmaceutical, medical device, home and personal care, and other consumer goods end markets. All markets are considered to be highly competitive as to price, innovation, quality and service.
Free historical financial statements for Amcor Plc. See how revenue, income, cash flow, and balance sheet financials have changed over 28 quarters since 2019. Compare with AMCR stock chart to see long term trends.
Data imported from Amcor Plc SEC filings. Check original filings before making any investment decision.