Free Alerts   Login

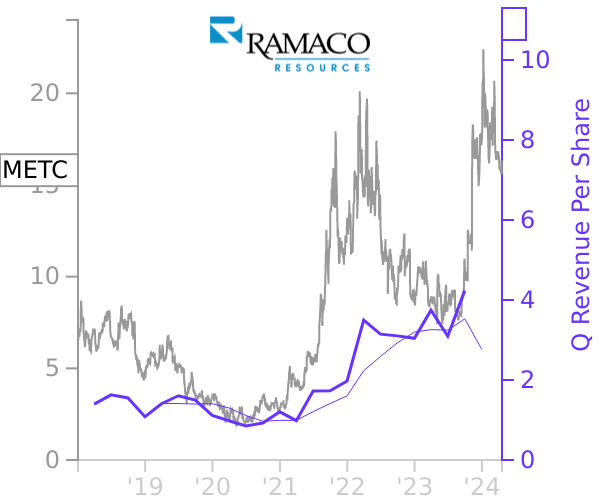
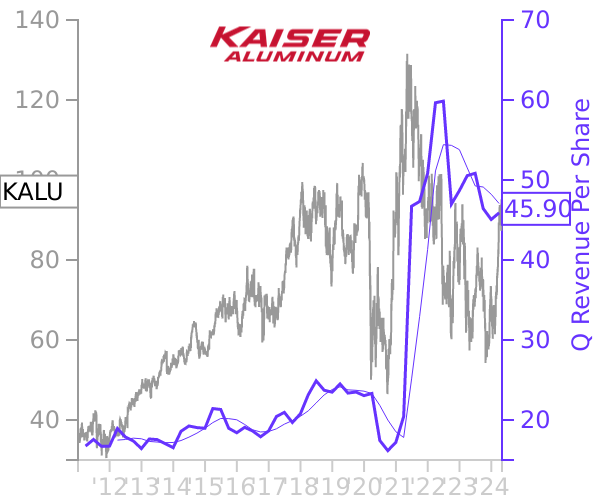
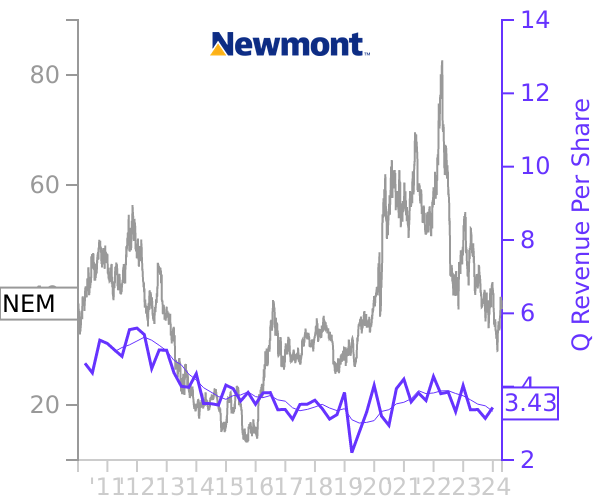
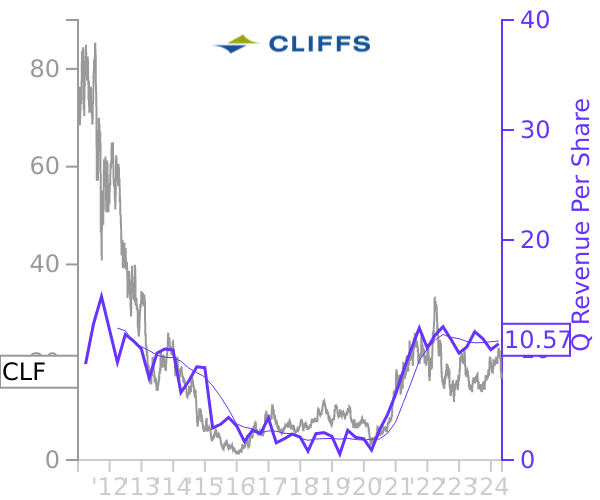
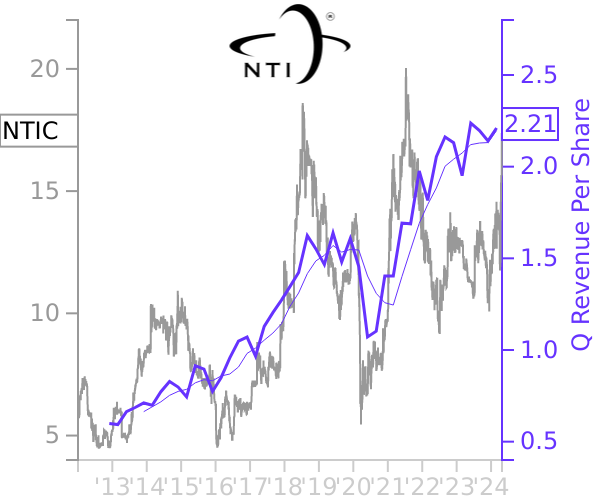
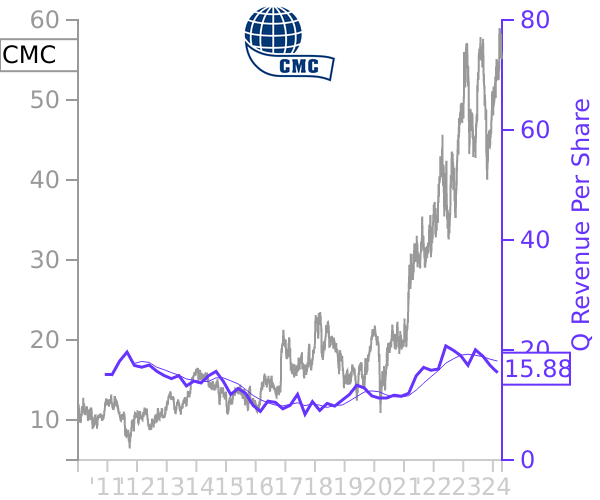
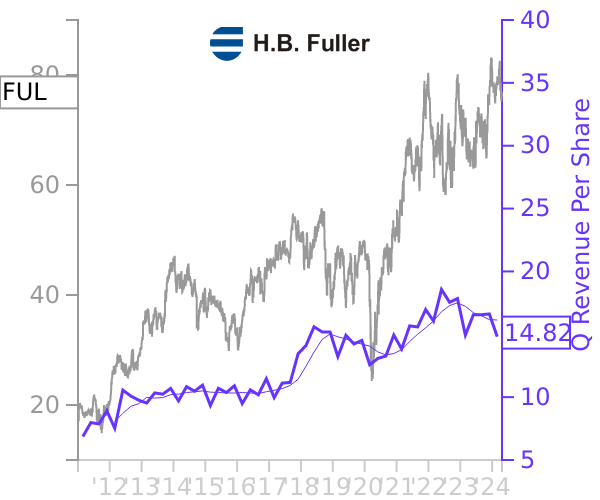
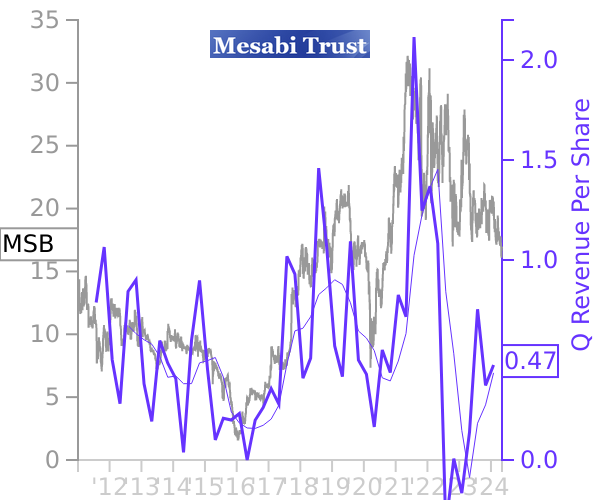
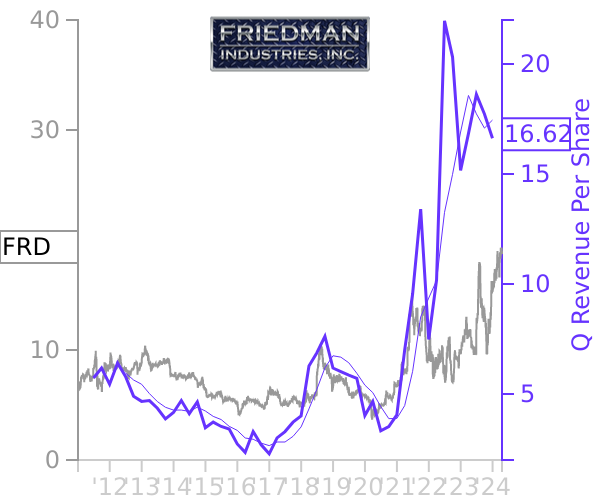
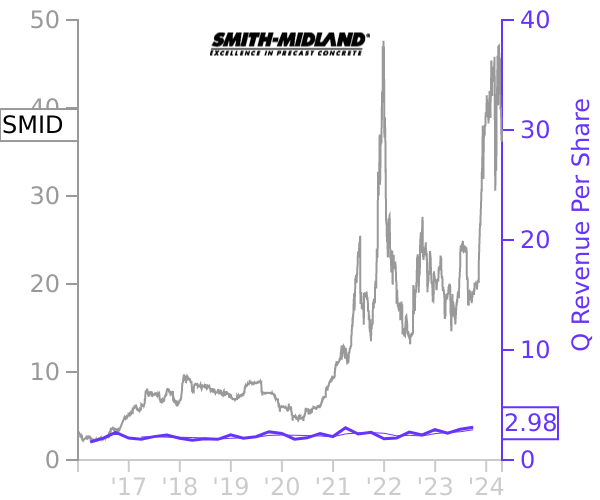
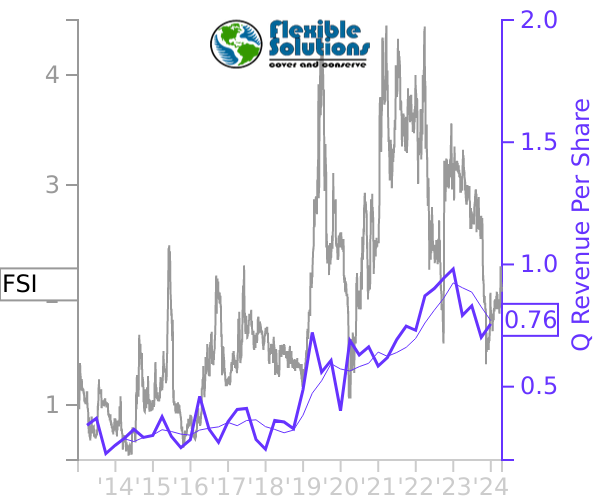
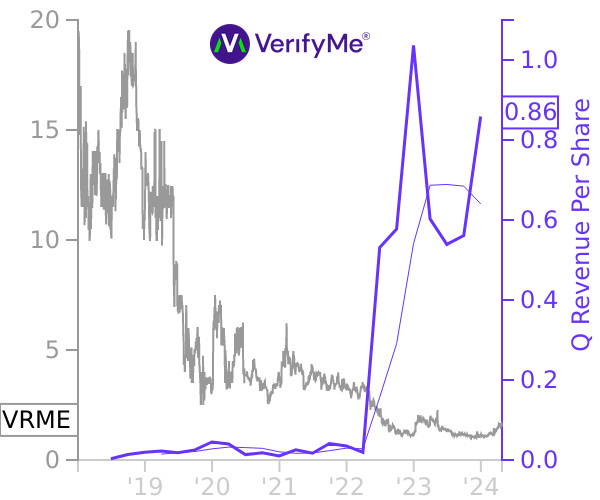
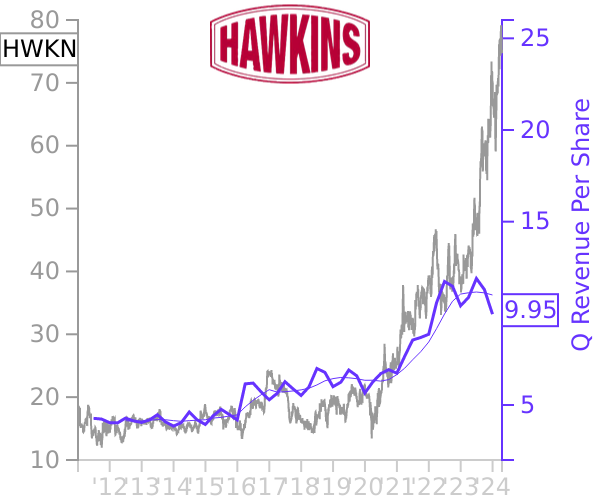
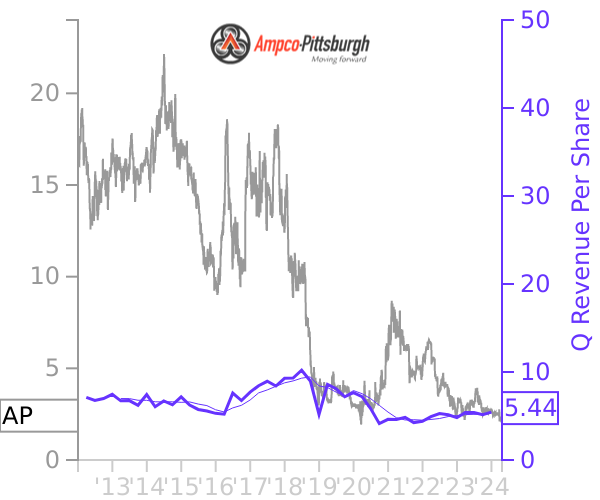
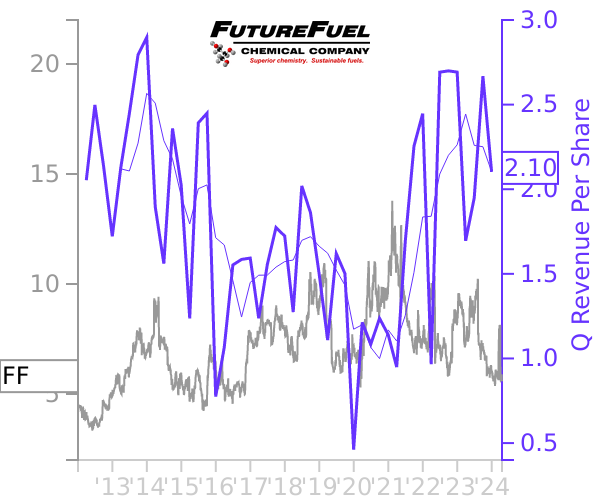
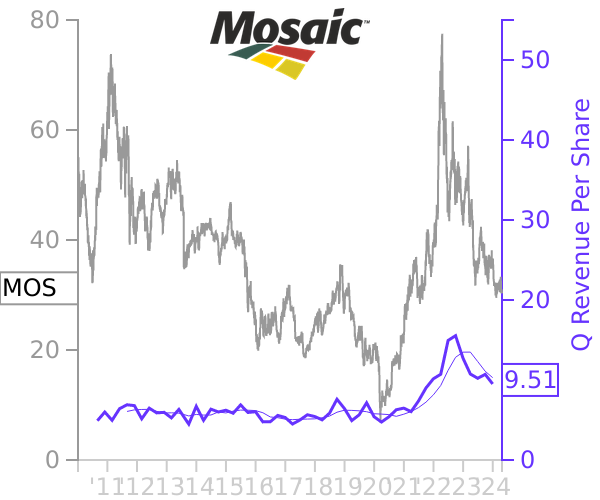
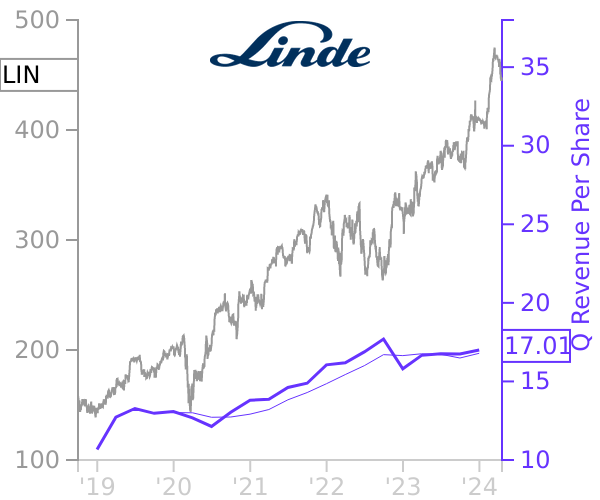
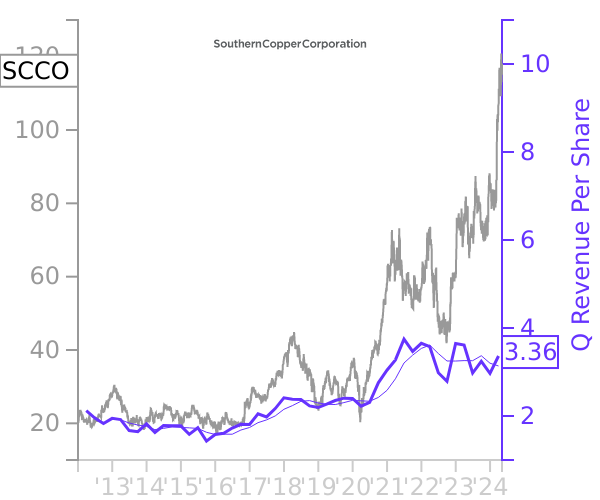
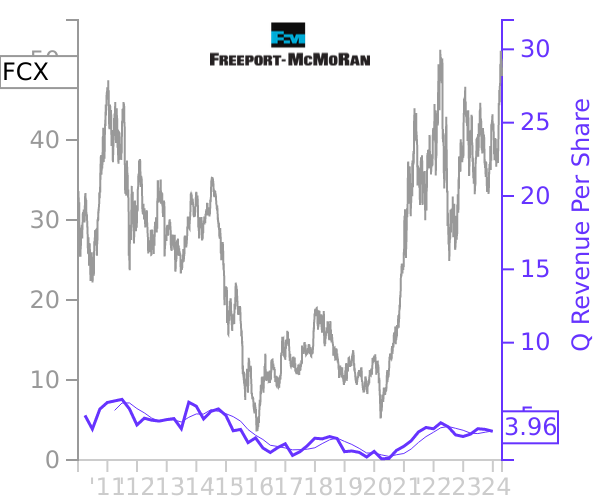
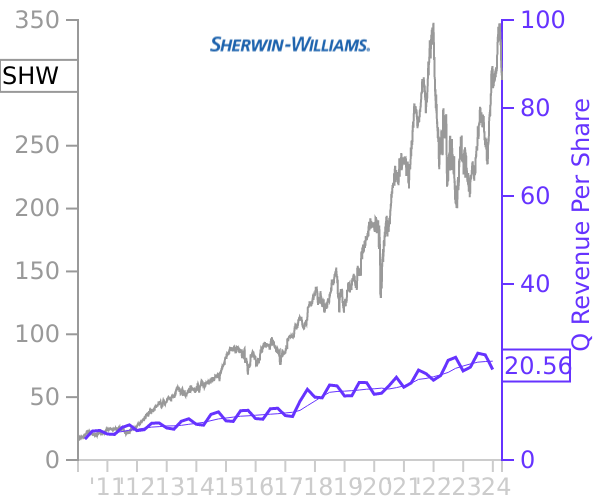
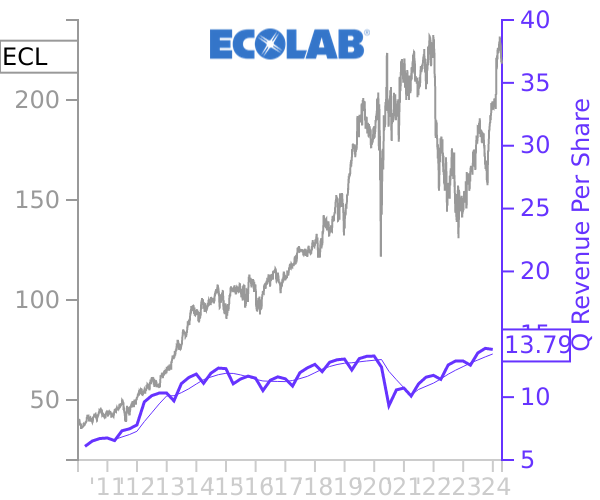
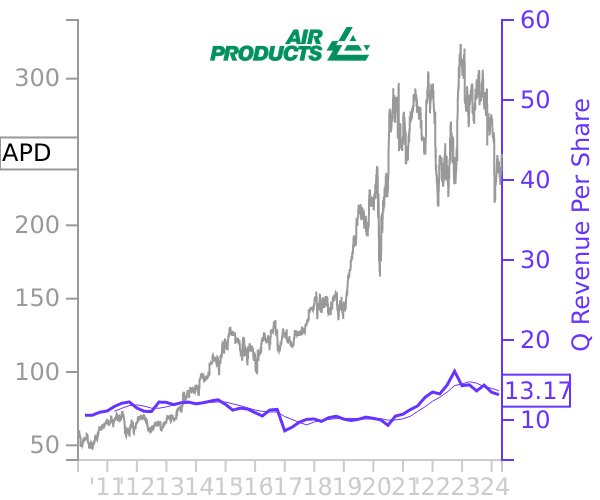
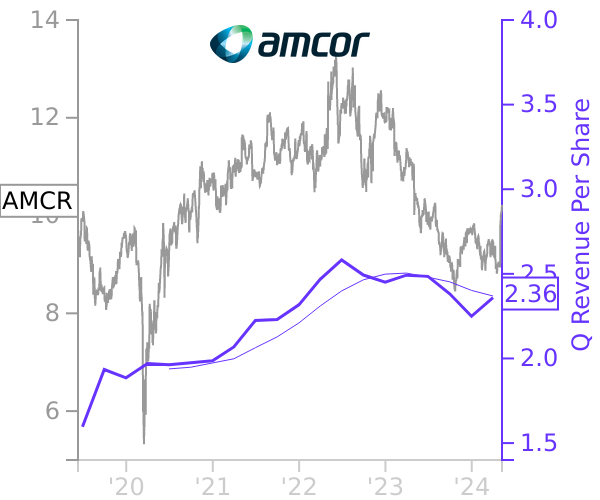
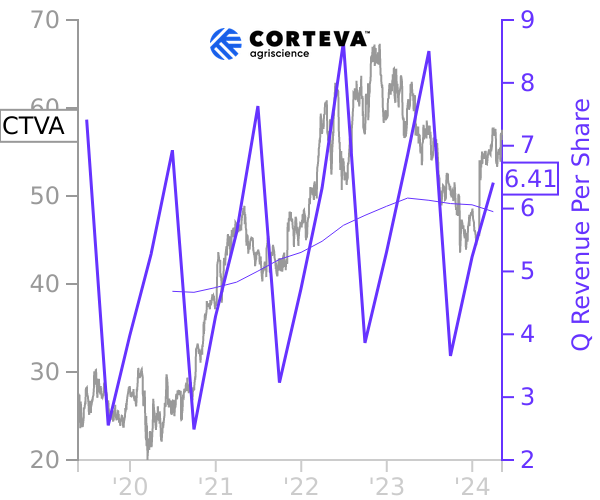
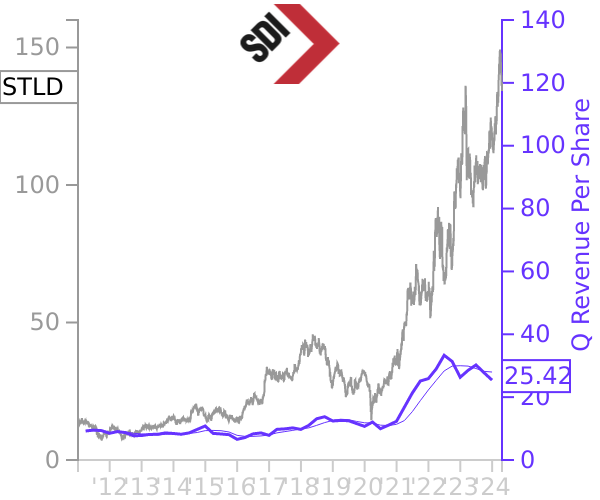
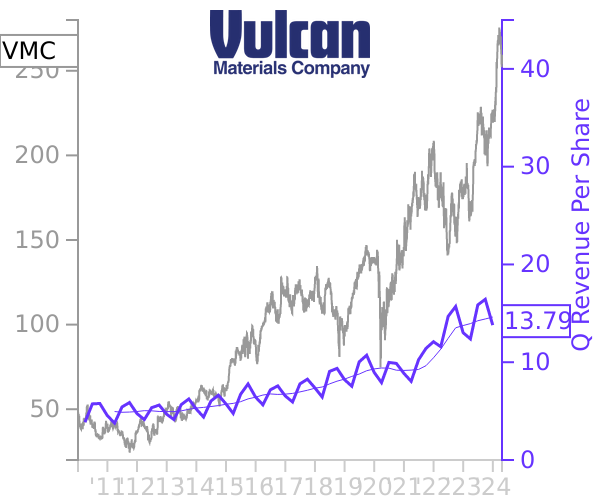
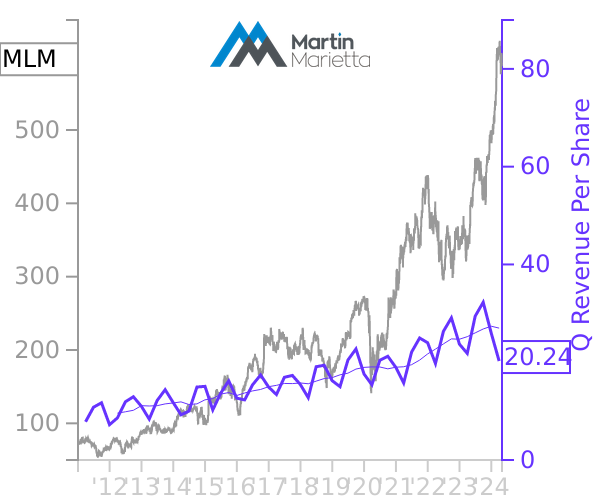
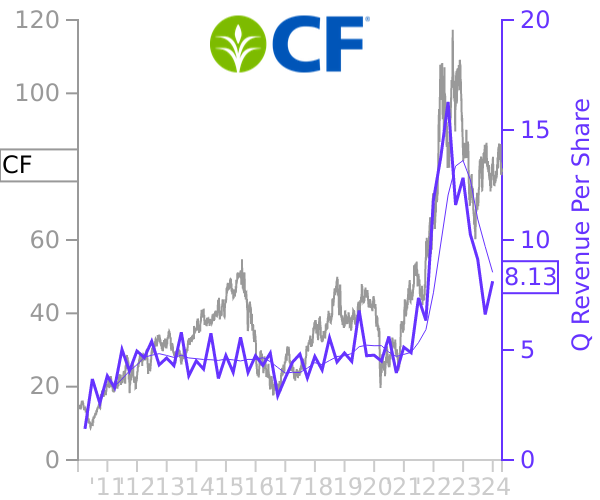
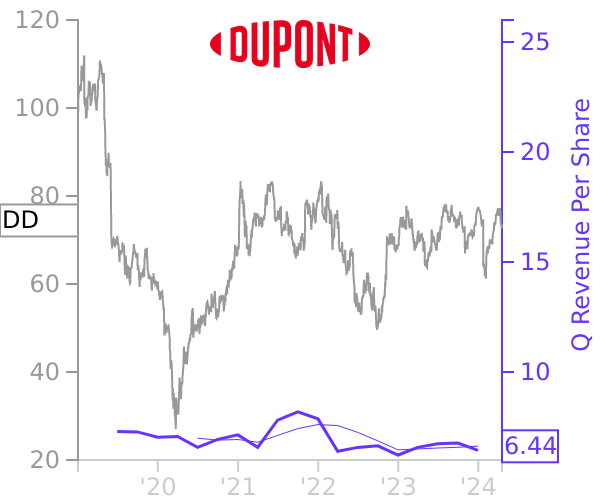
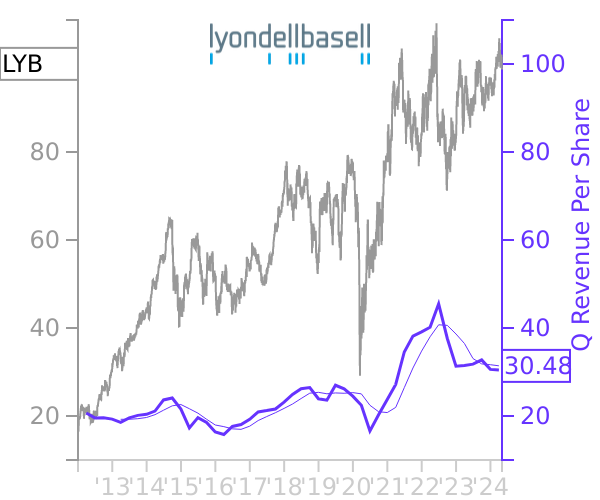
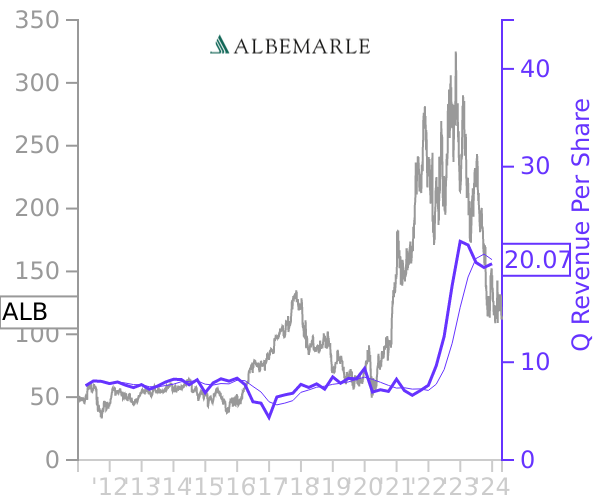
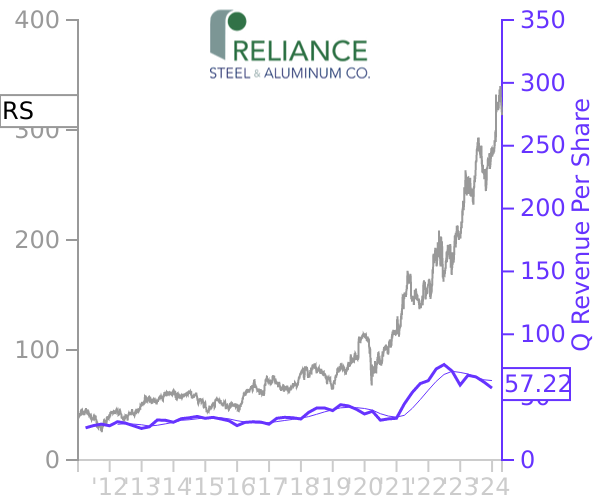
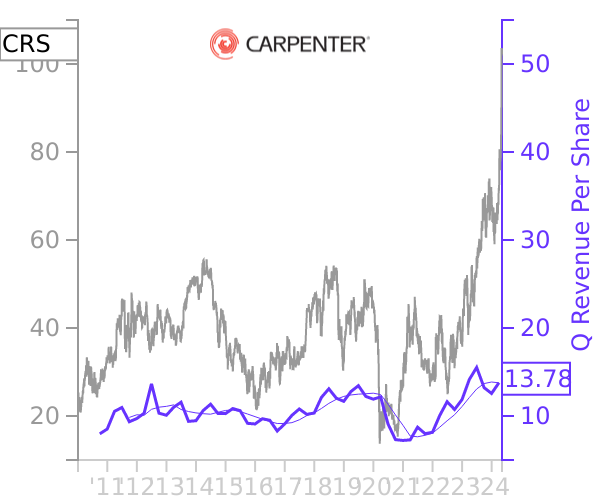
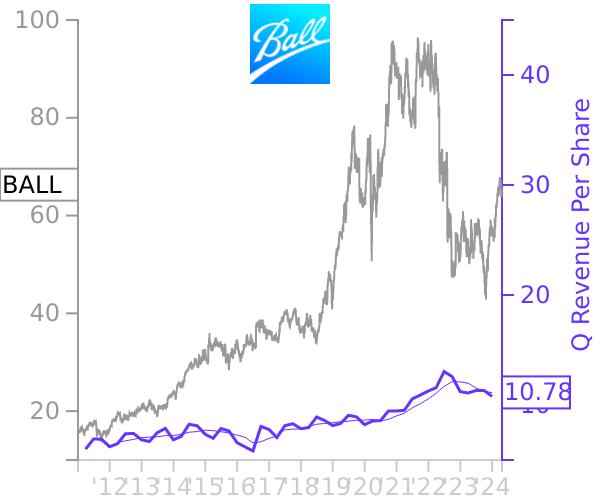
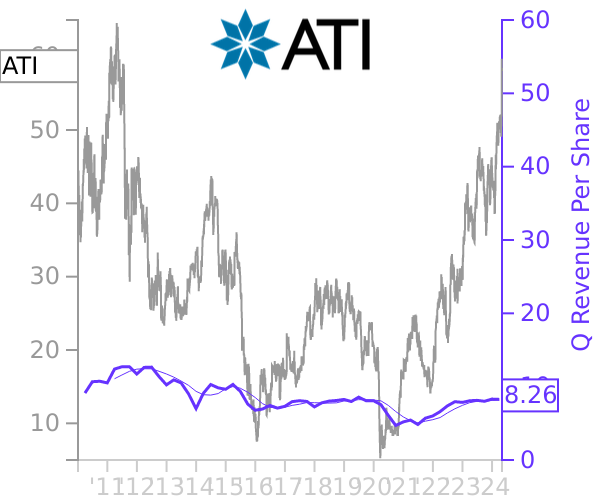
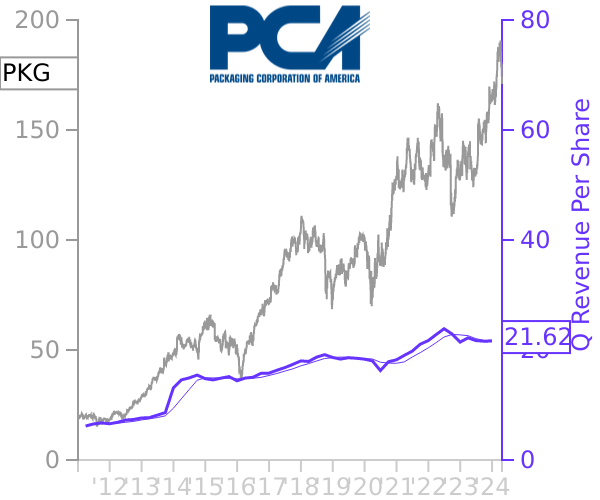
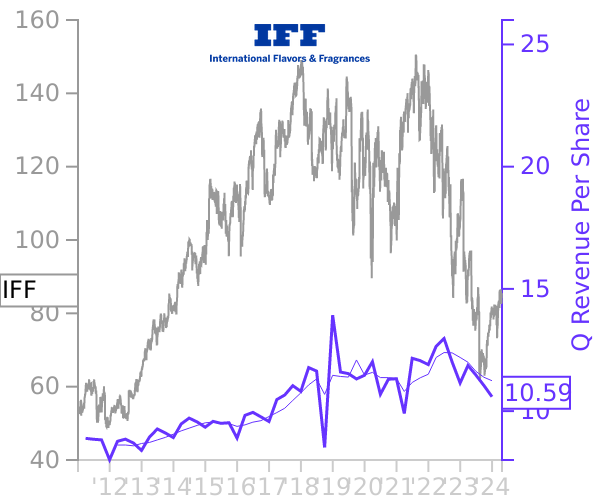
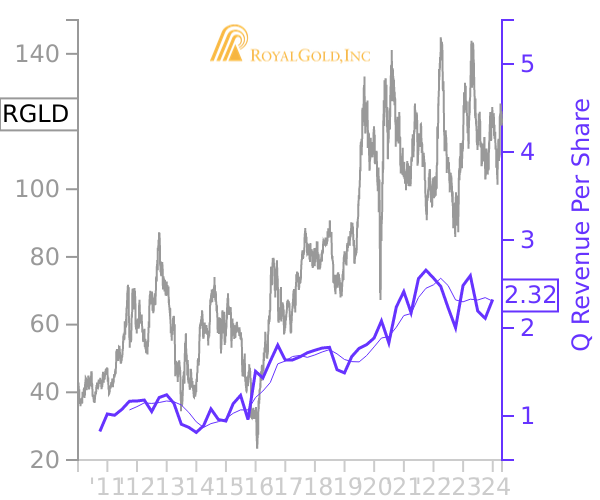
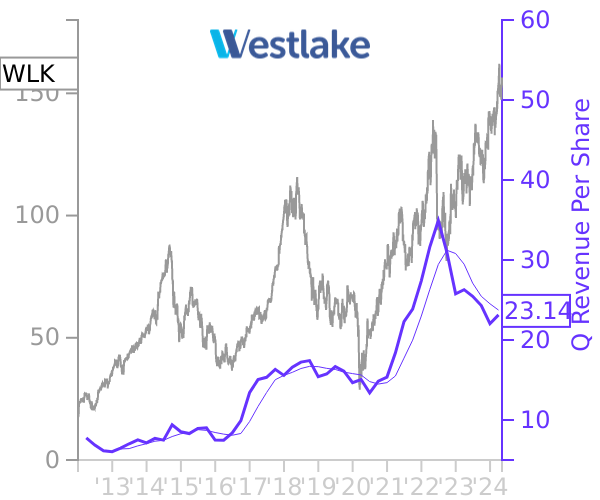
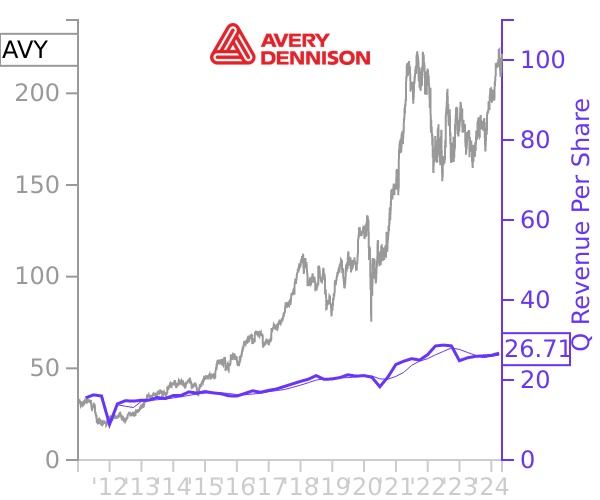
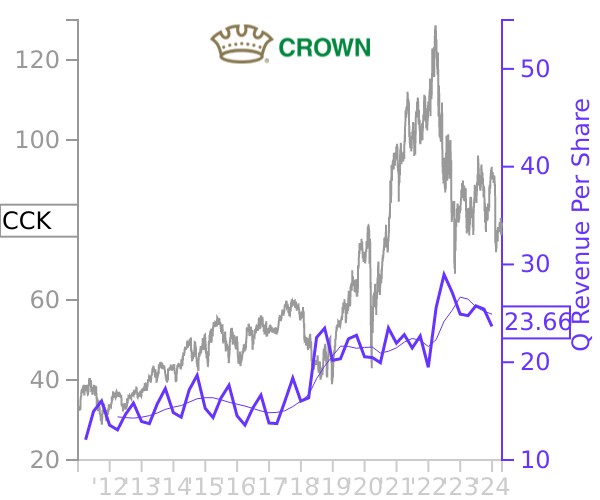
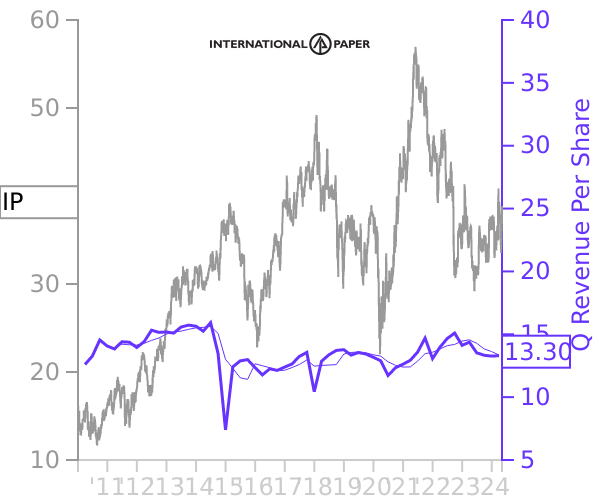
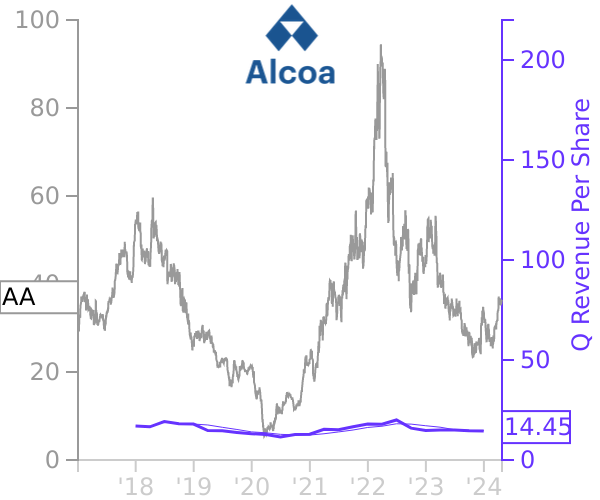
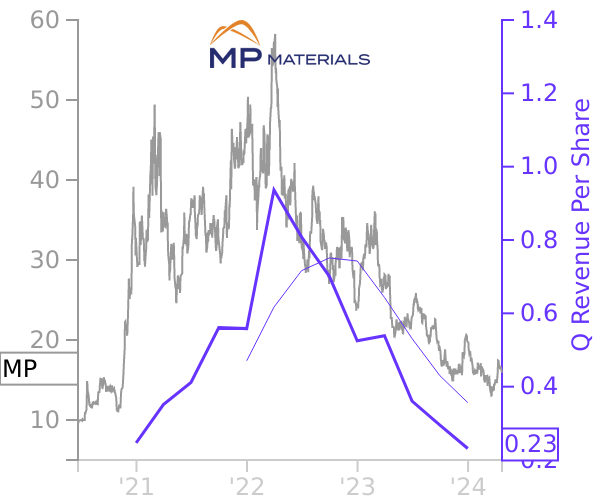
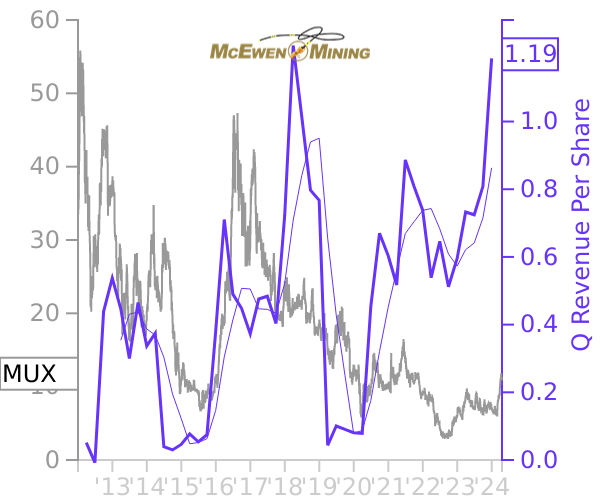
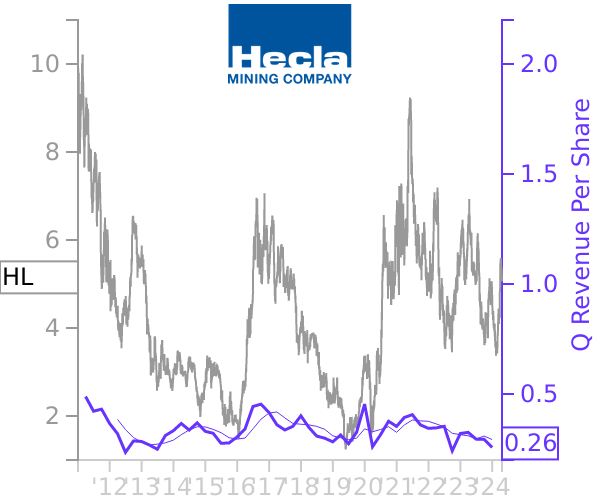
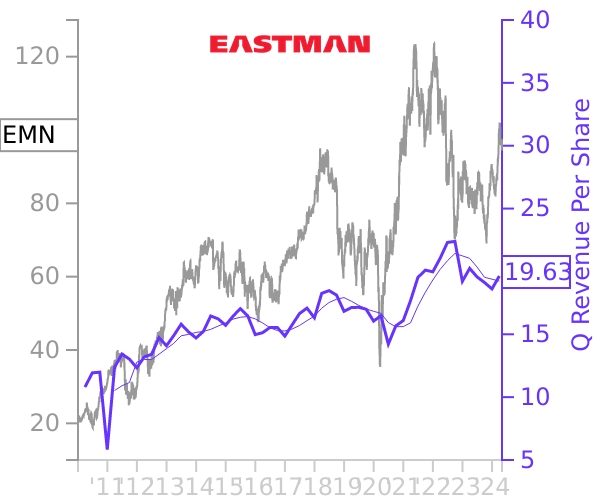
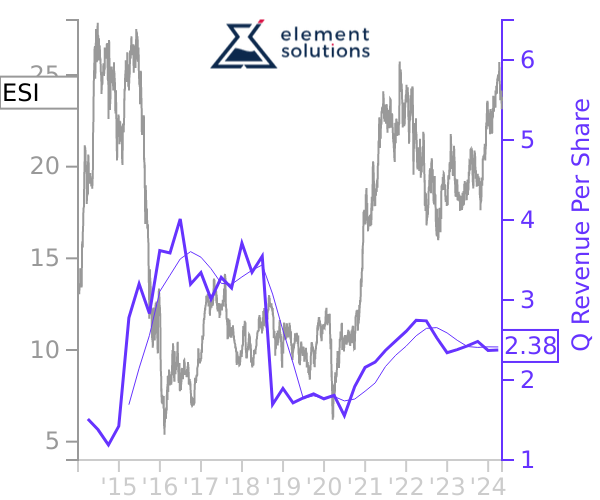
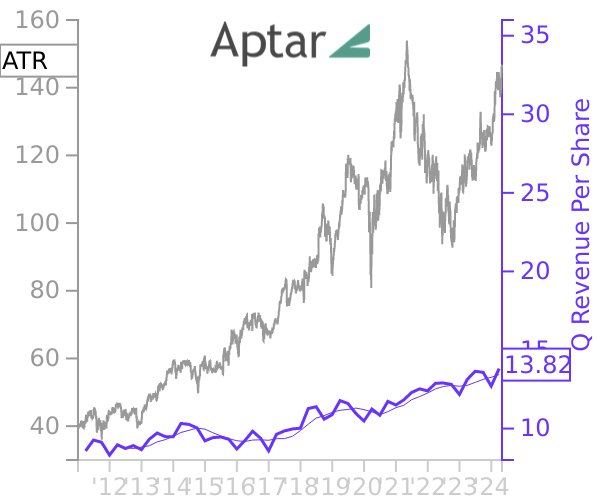
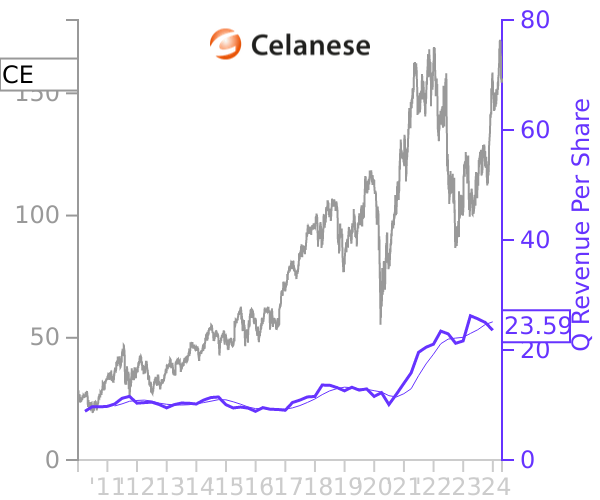
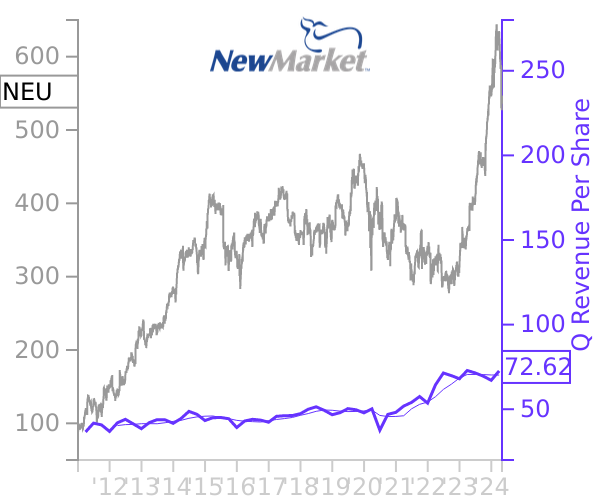
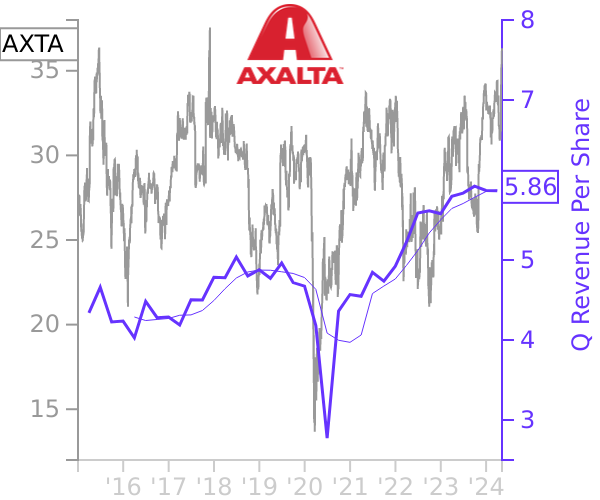
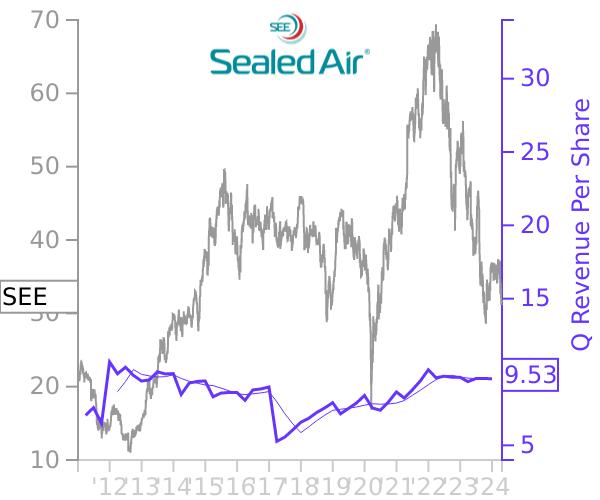
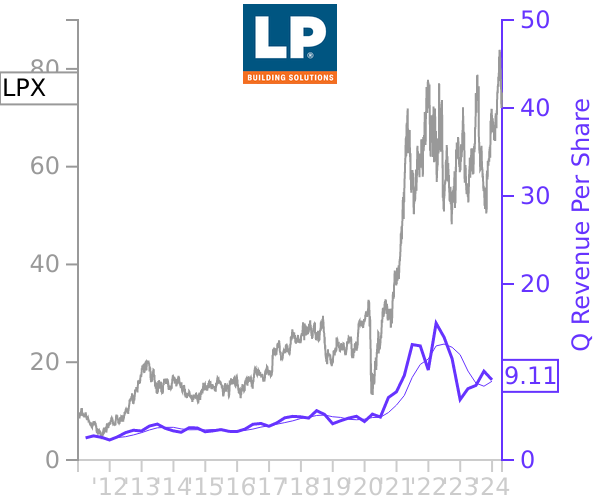
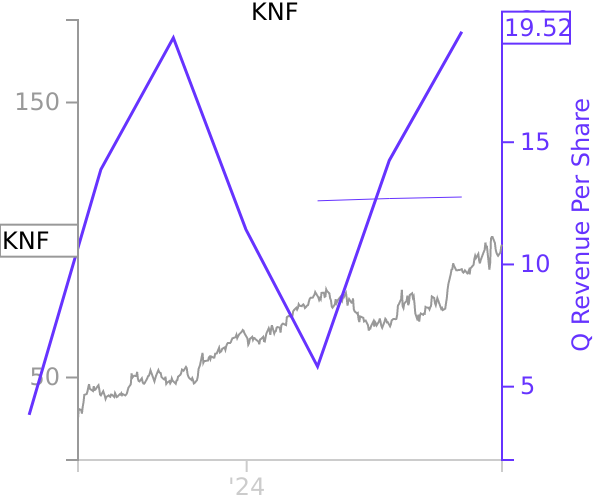
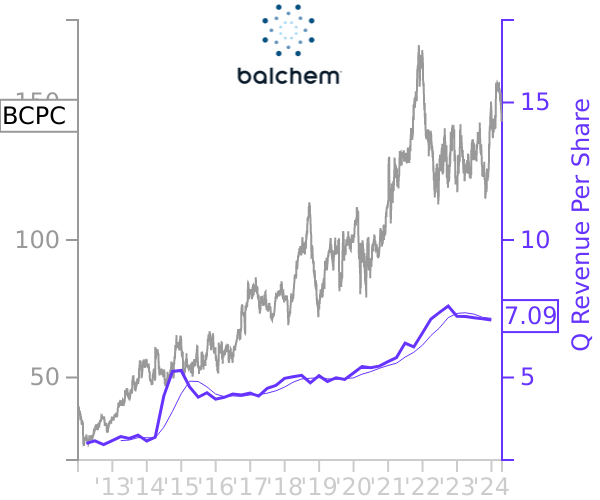
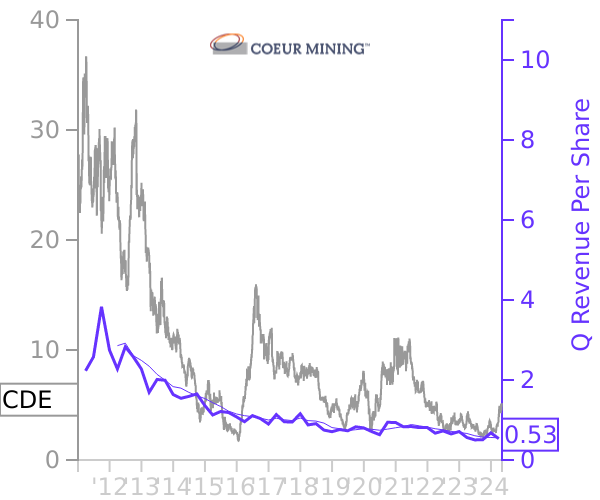
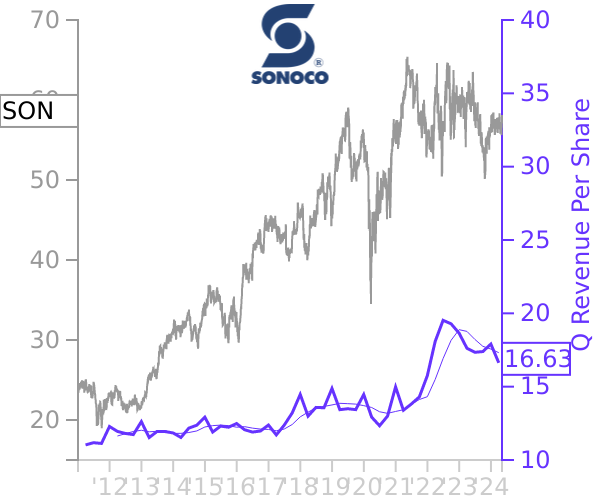
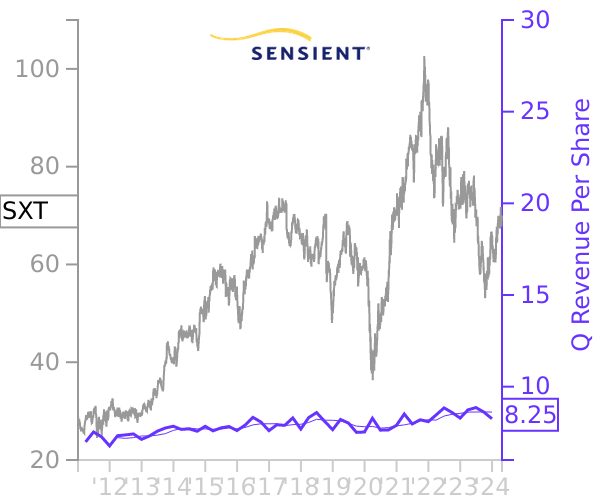
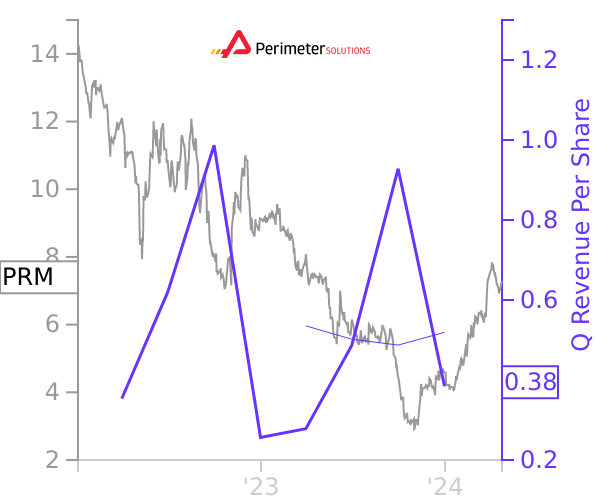
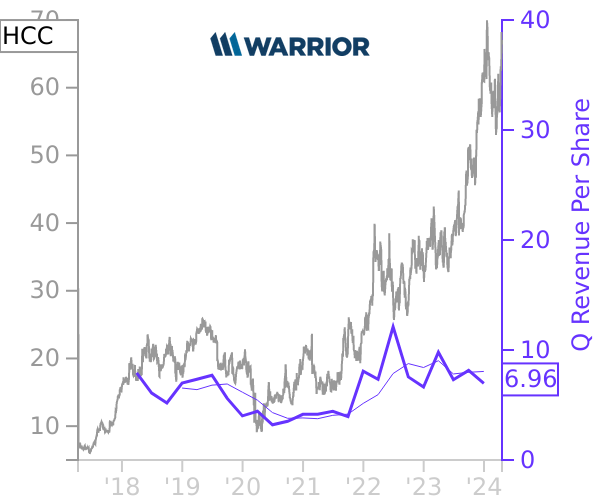
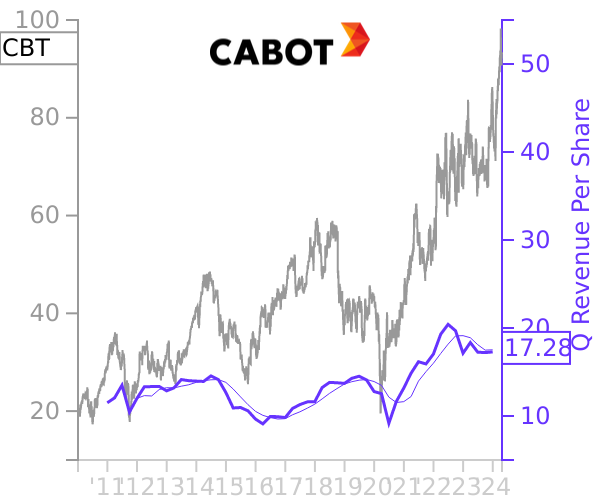
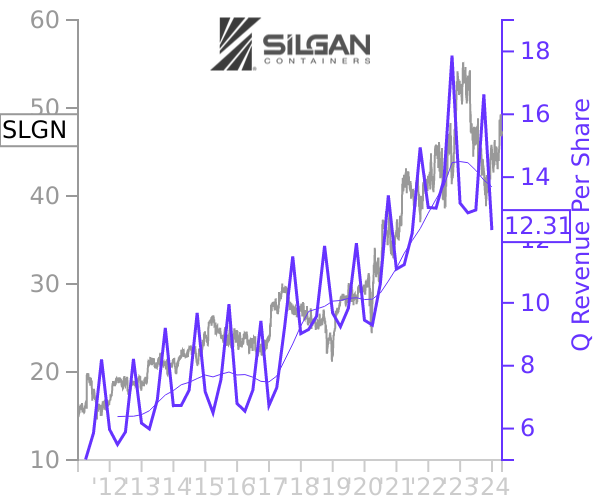
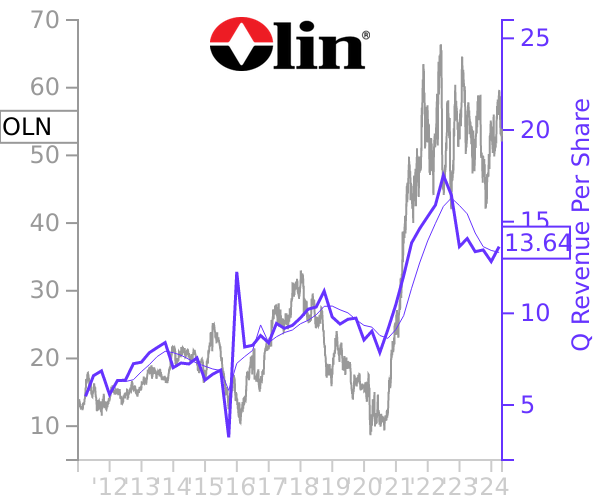
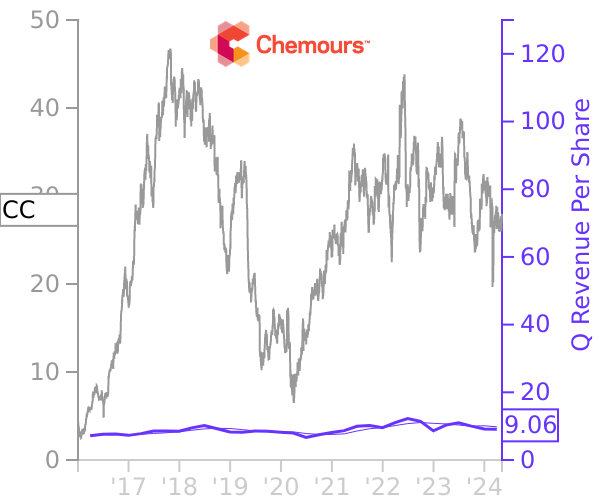
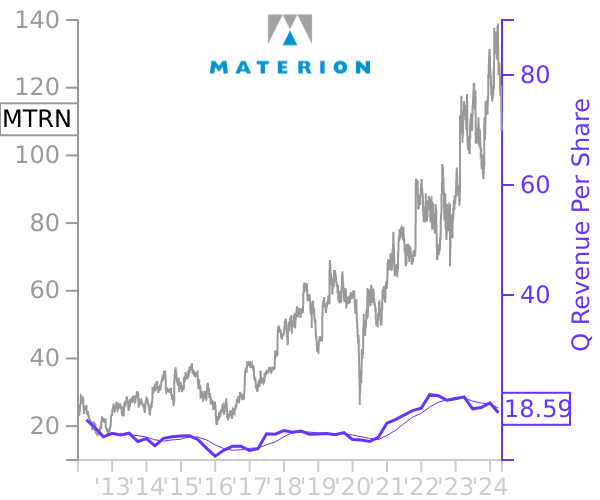
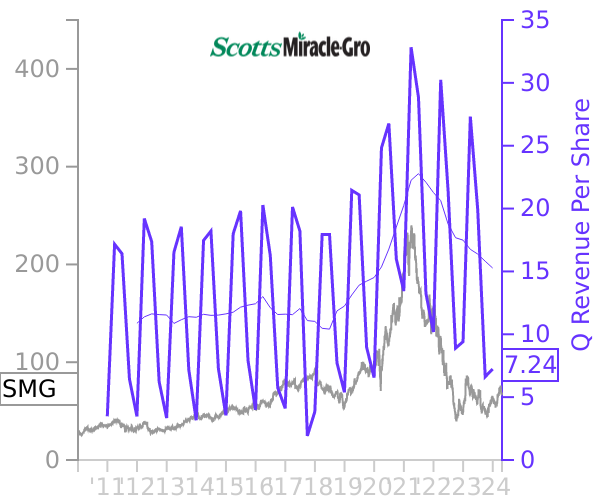
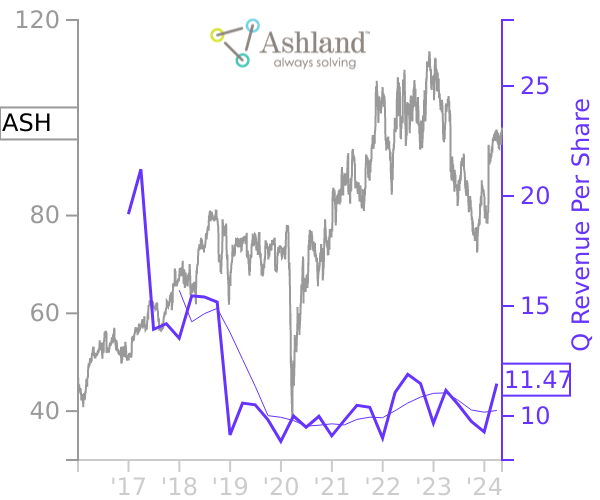
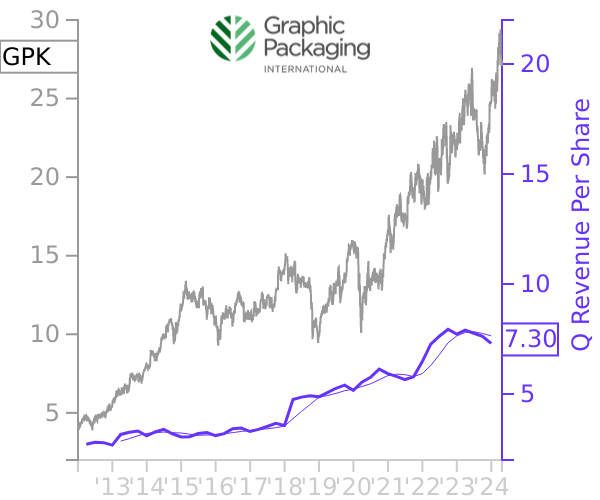
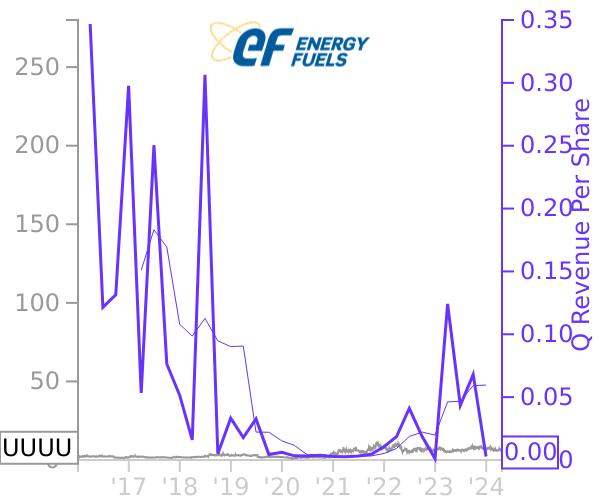
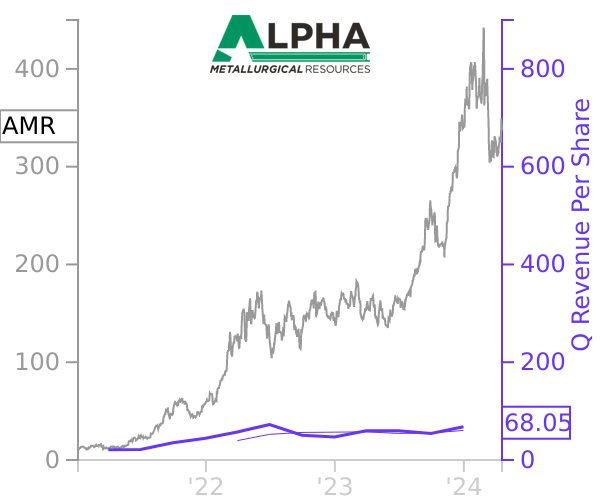
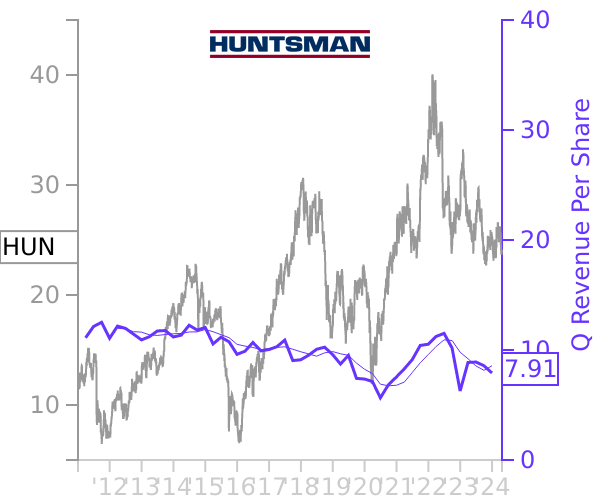
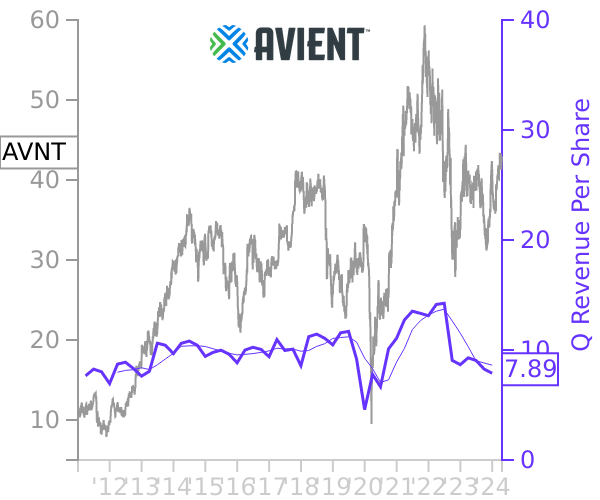
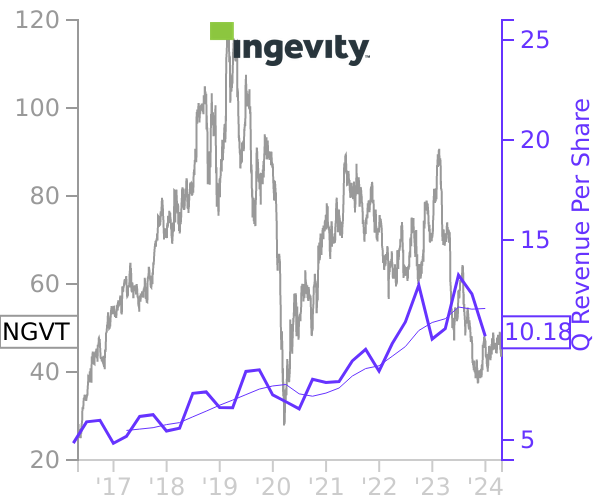
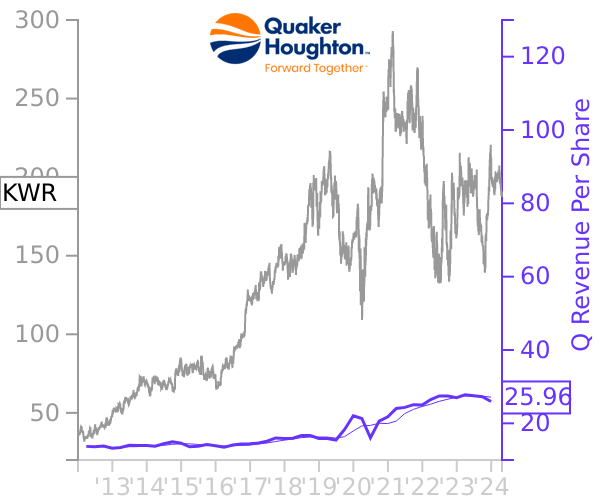
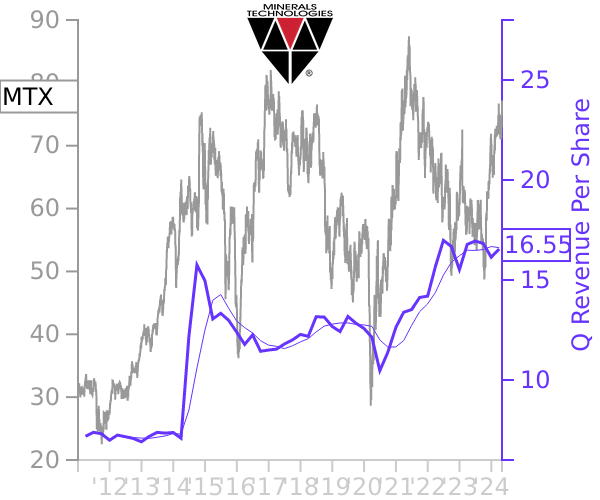
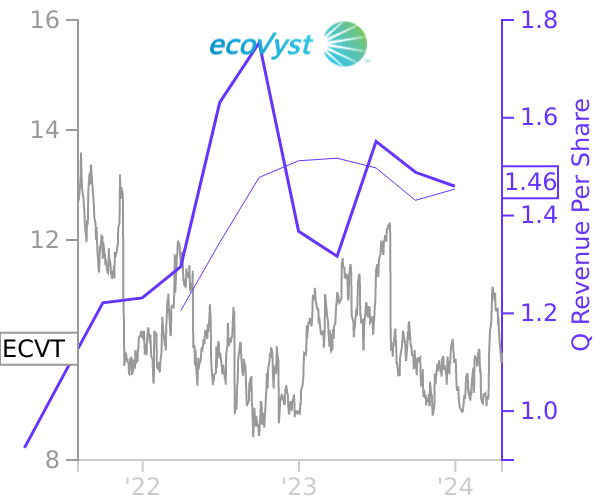
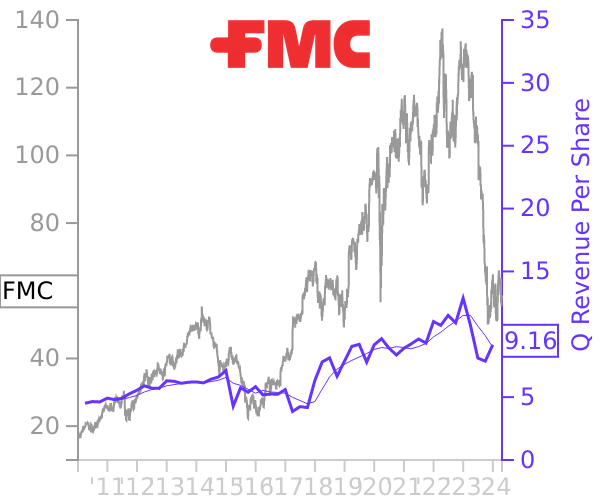
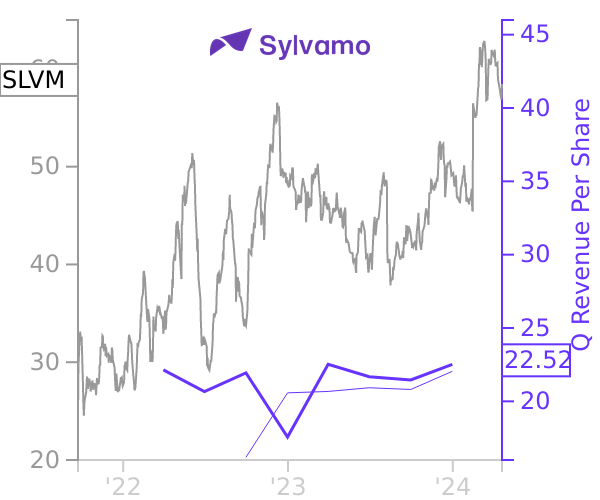
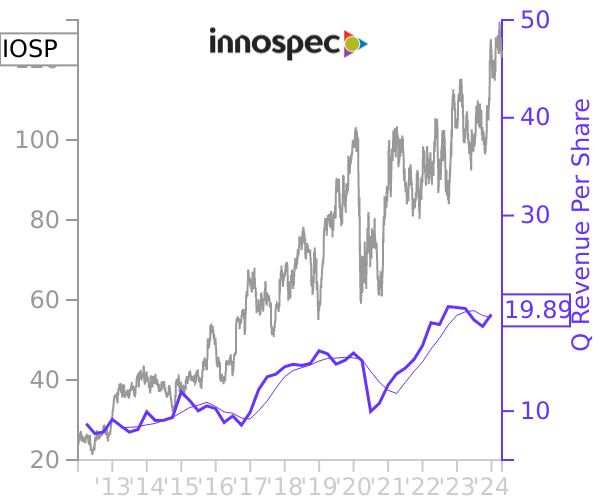
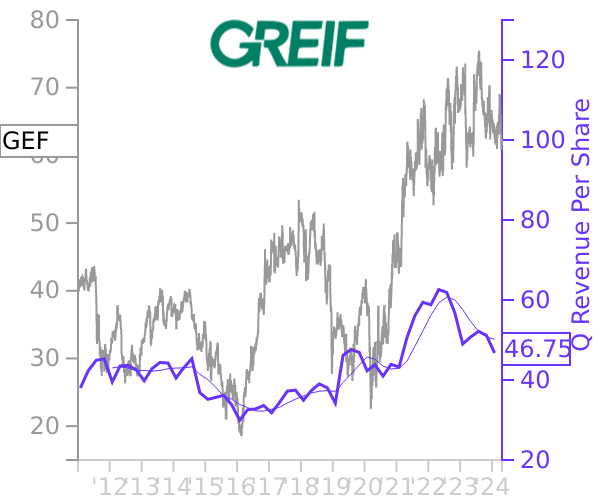
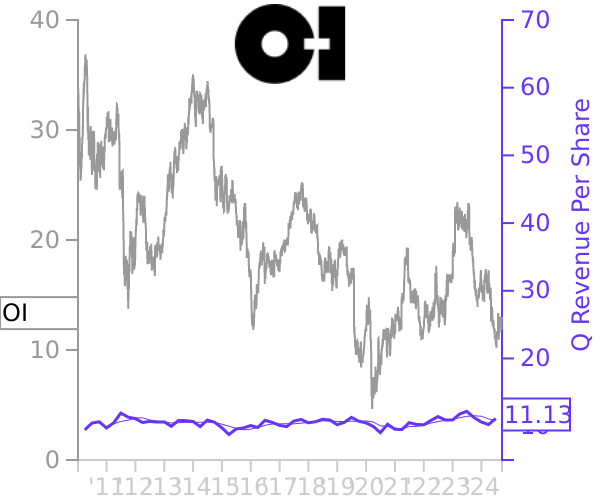
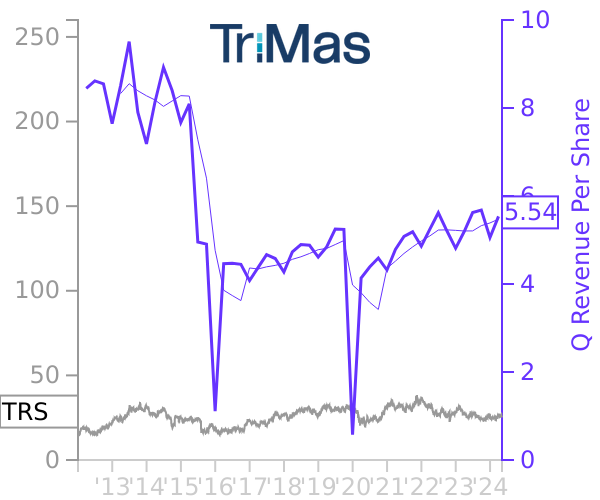
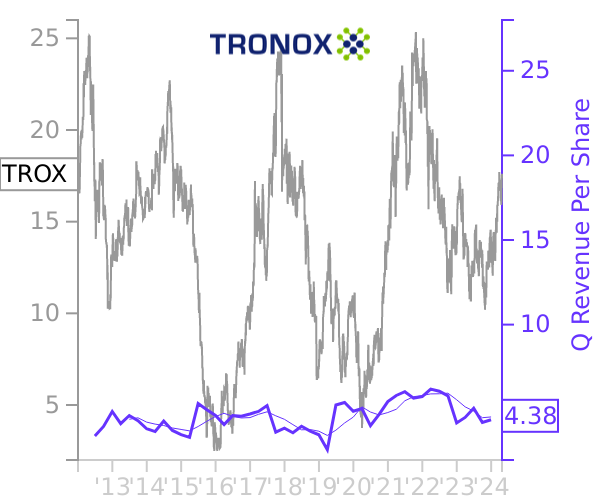
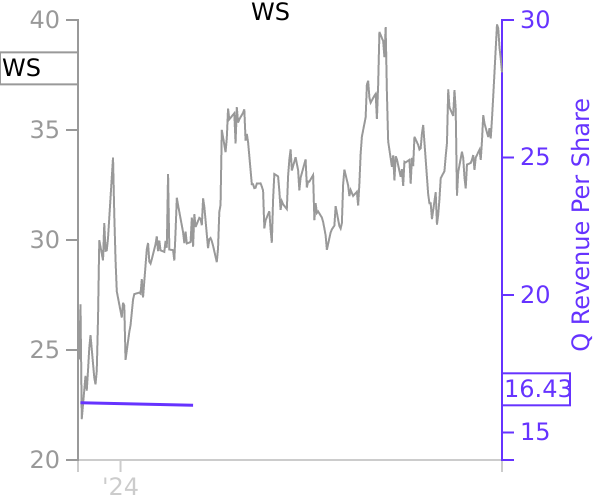
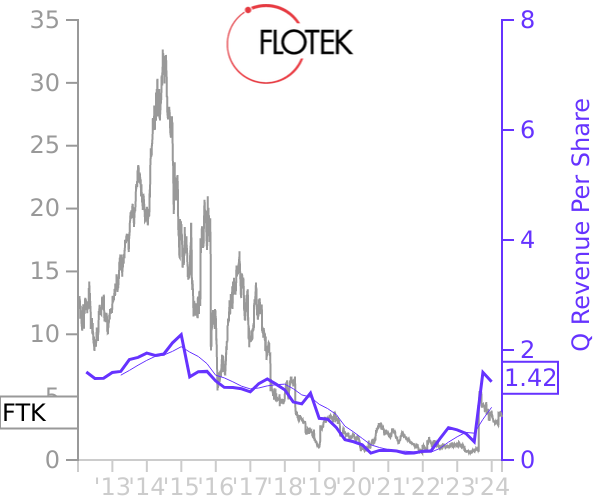
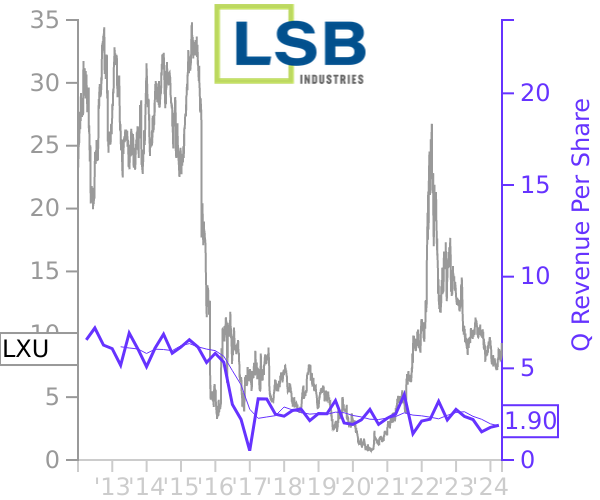
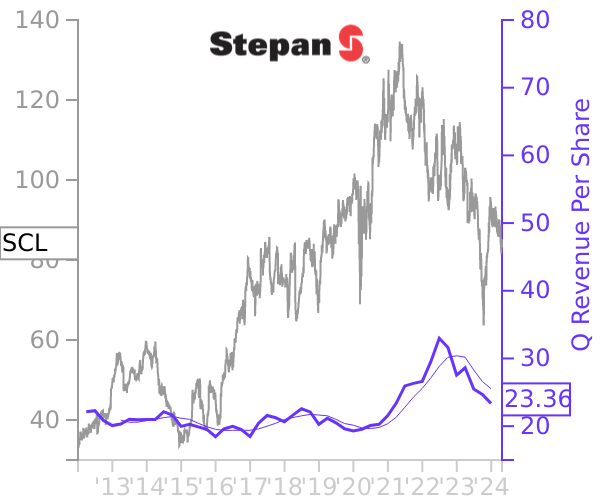
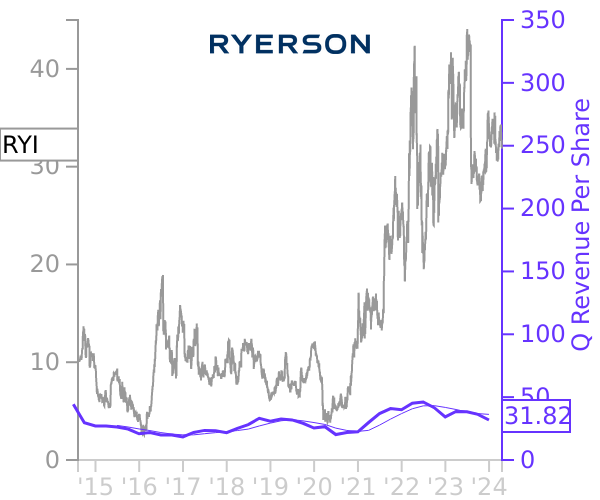
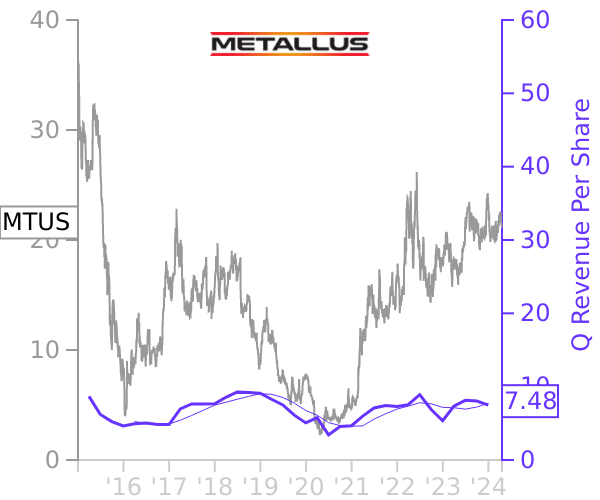
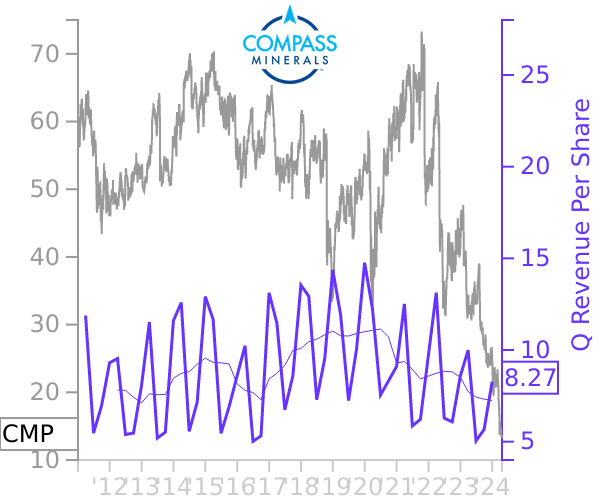
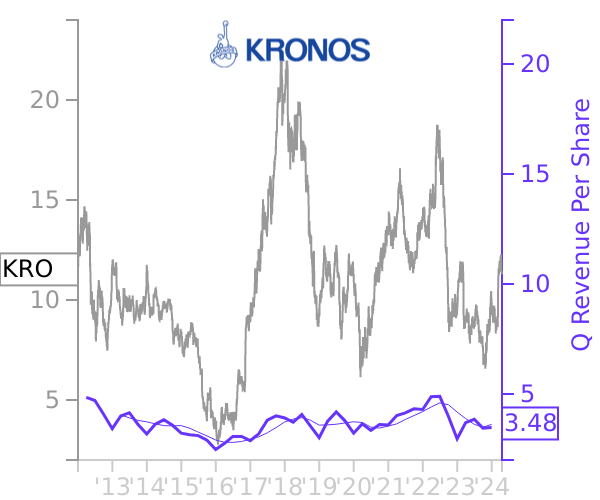
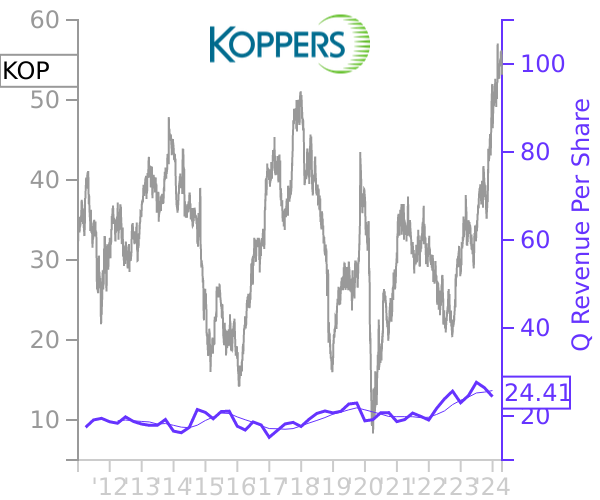
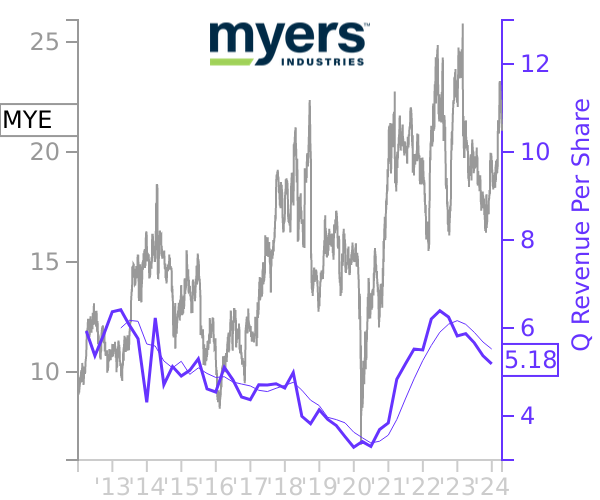
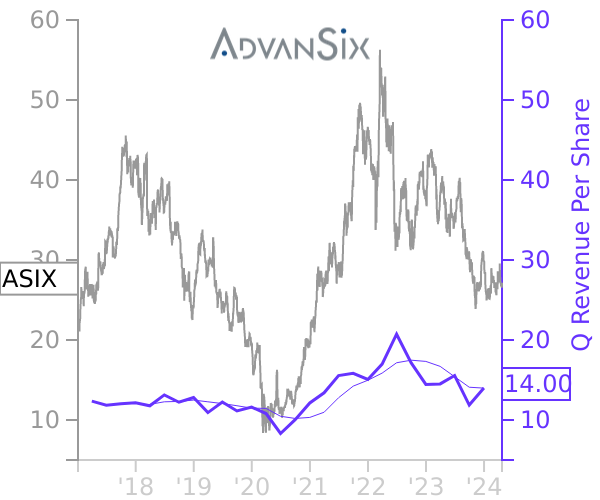
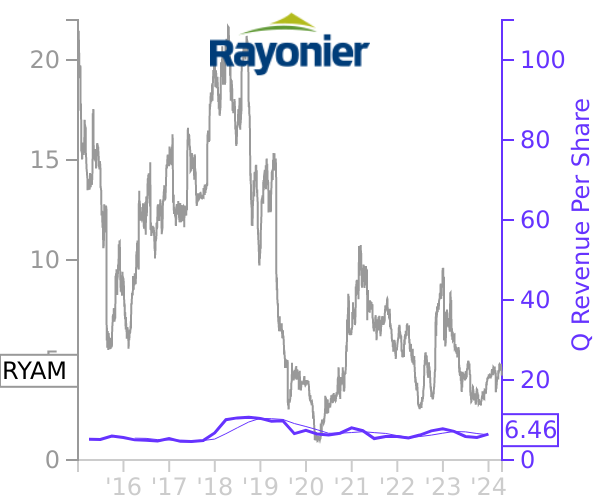
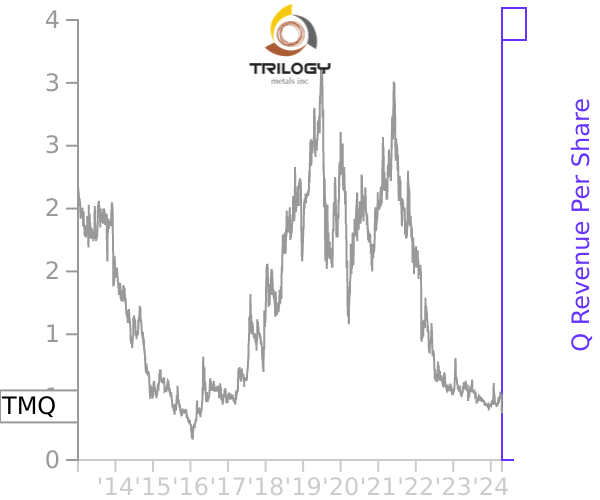
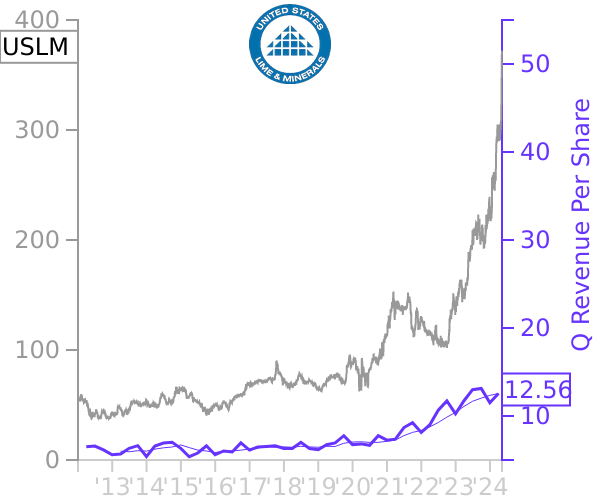
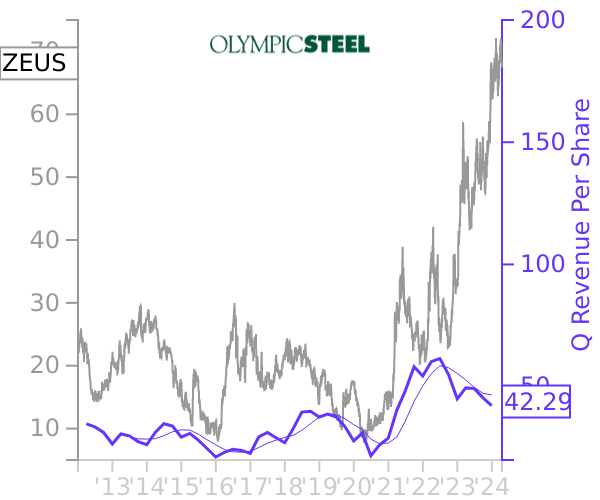
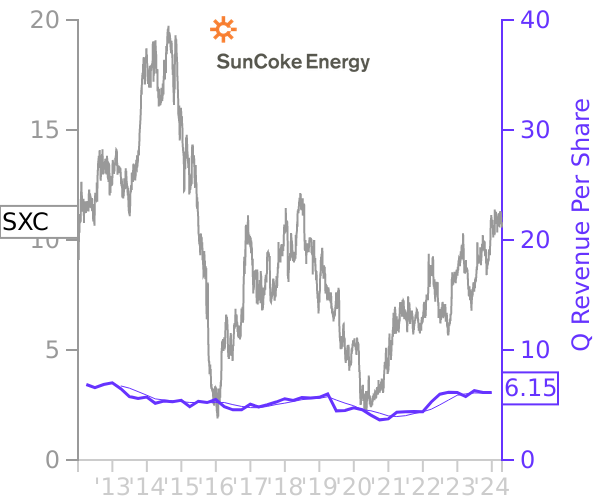
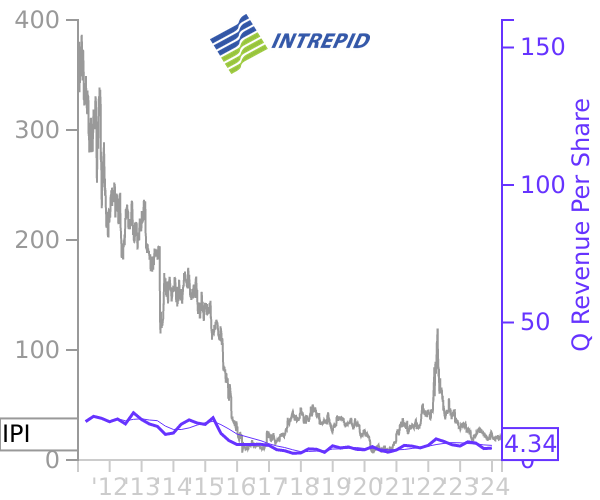
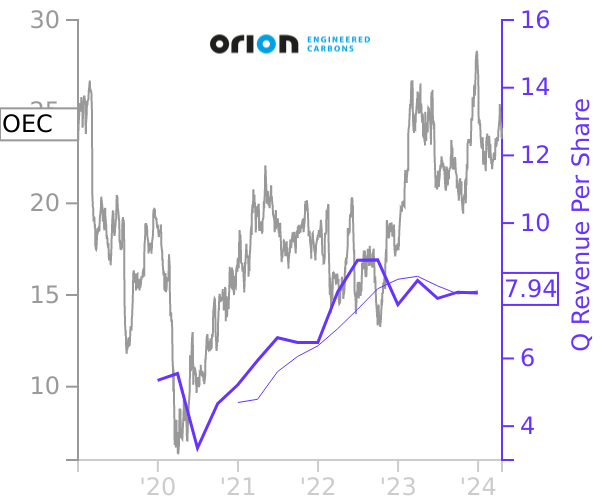
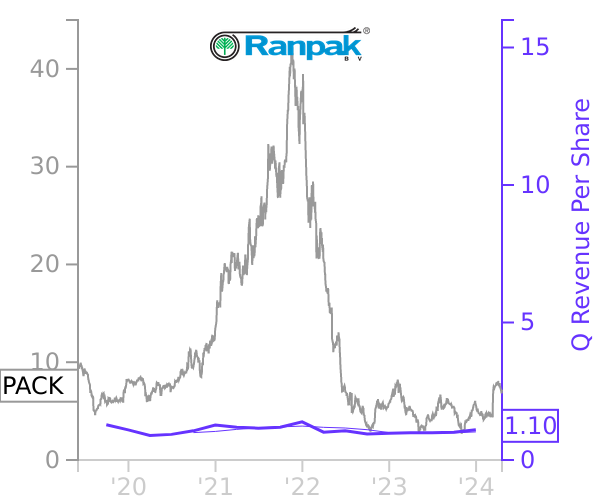
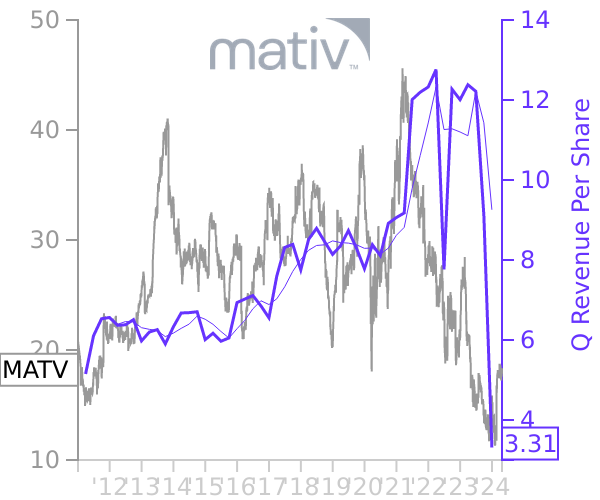
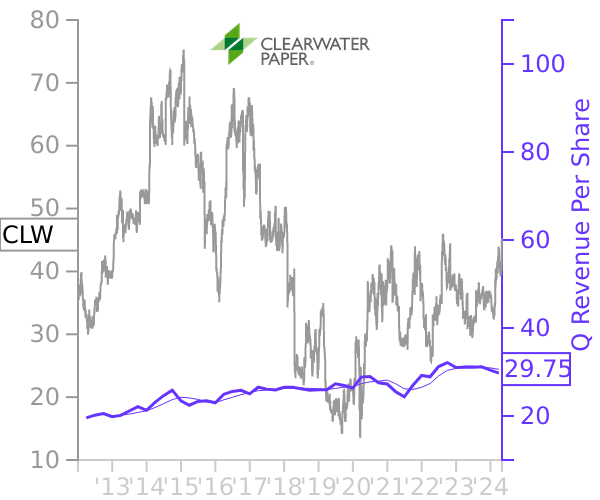
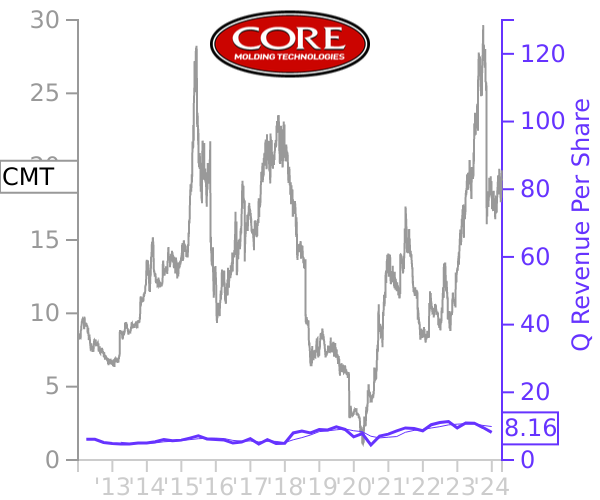
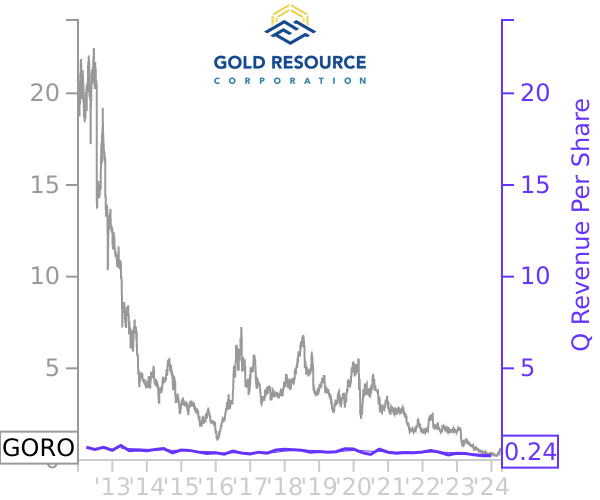
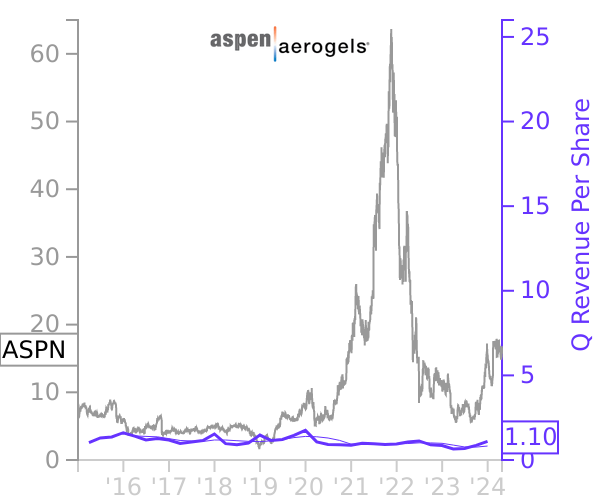
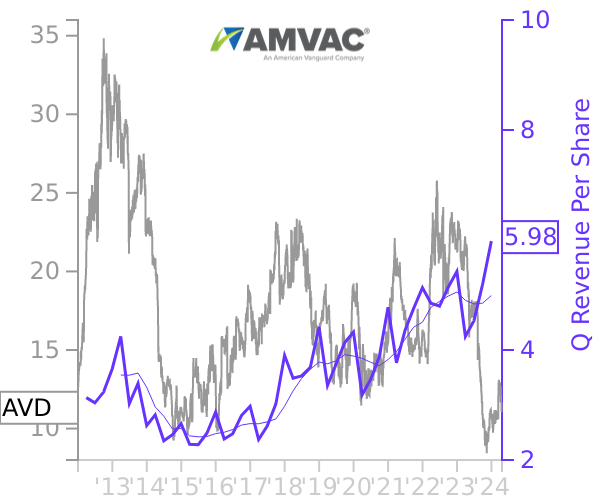
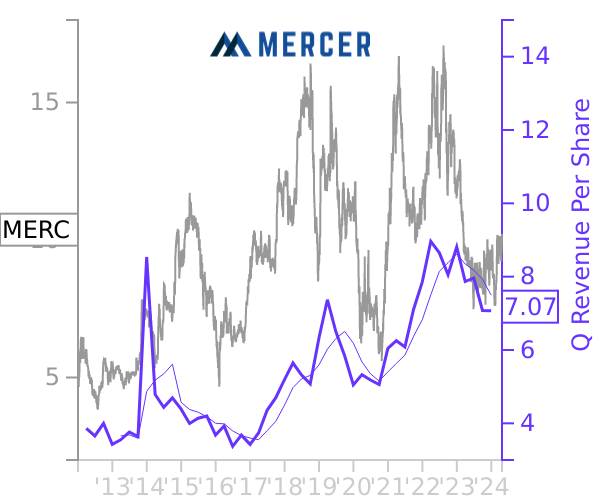
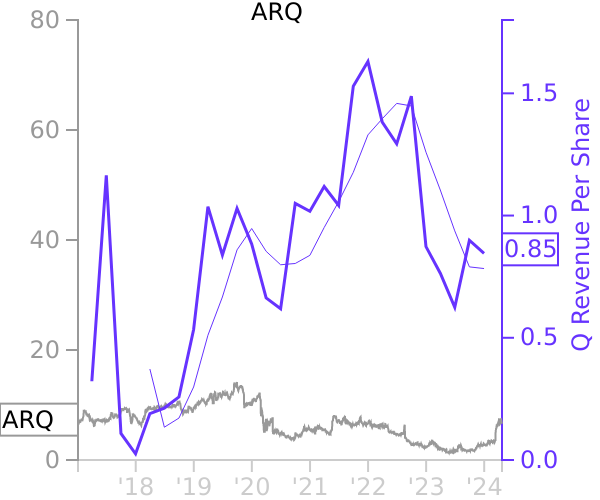
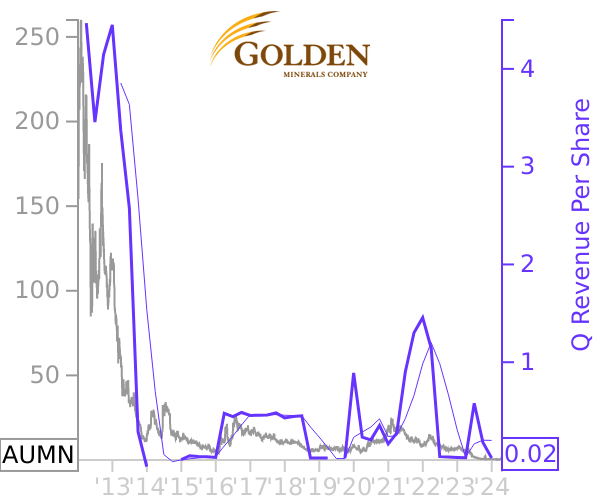
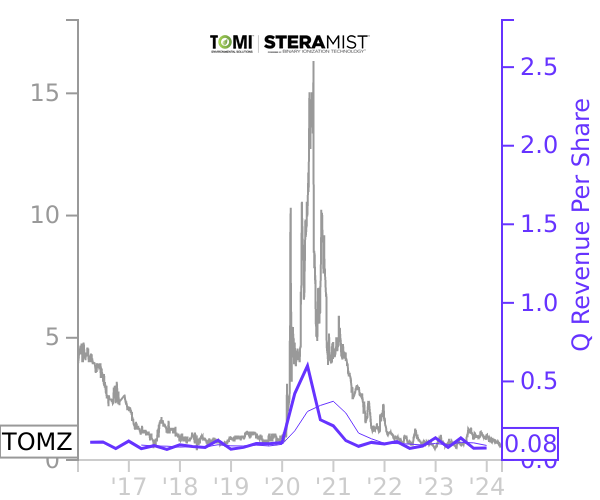
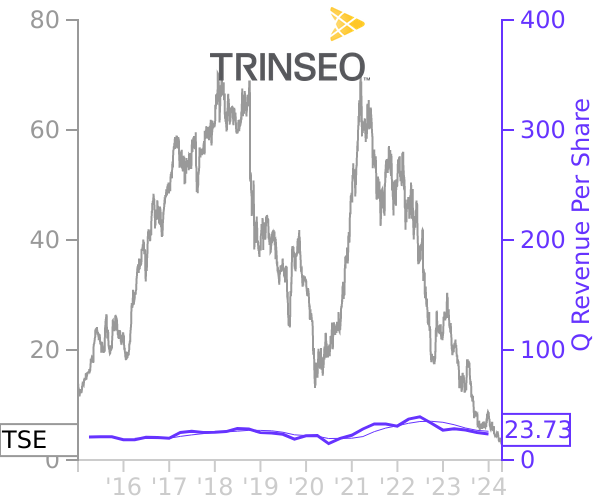
Materials Stock Prices vs Revenue

Quarterly revenue and earnings fluctuate like stock prices. Get the big picture with insights from company insiders and leading investors.

Recent Filings
Largest Companies
Insider Buying

Largest Market Caps

Linde
LIN stock chart compared to revenue
Southern Copper
SCCO stock chart compared to revenue
Sherwin-Williams Co
SHW stock chart compared to revenue
Freeport-McMoRan
FCX stock chart compared to revenue
Ecolab
ECL stock chart compared to revenue
Air Products & Chemicals
APD stock chart compared to revenue
Nucor
NUE stock chart compared to revenue
Newmont
NEM stock chart compared to revenue
Dow
DOW stock chart compared to revenue
Corteva
CTVA stock chart compared to revenue
Martin Marietta Materials
MLM stock chart compared to revenue
Vulcan Materials Co
VMC stock chart compared to revenue
DuPont de Nemours
DD stock chart compared to revenue
PPG Industries
PPG stock chart compared to revenue
LyondellBasell Industries NV
LYB stock chart compared to revenue
International Flavors & Fragrances
IFF stock chart compared to revenue
Steel Dynamics
STLD stock chart compared to revenue
Ball
BALL stock chart compared to revenue
Reliance Steel & Aluminum Co
RS stock chart compared to revenue
Avery Dennison
AVY stock chart compared to revenue
Packaging Corp of America
PKG stock chart compared to revenue
Celanese
CE stock chart compared to revenue
CF Industries Holdings
CF stock chart compared to revenue
Amcor
AMCR stock chart compared to revenue
Albemarle
ALB stock chart compared to revenue
RPM International
RPM stock chart compared to revenue
Westrock Co
WRK stock chart compared to revenue
International Paper Co
IP stock chart compared to revenue
Eastman Chemical Co
EMN stock chart compared to revenue
Mosaic Co
MOS stock chart compared to revenue
Cleveland-Cliffs
CLF stock chart compared to revenue
Crown Holdings
CCK stock chart compared to revenue
AptarGroup
ATR stock chart compared to revenue
United States Steel
X stock chart compared to revenue
Graphic Packaging Holding Co
GPK stock chart compared to revenue
Eagle Materials
EXP stock chart compared to revenue
Royal Gold
RGLD stock chart compared to revenue
FMC
FMC stock chart compared to revenue
Axalta Coating Systems
AXTA stock chart compared to revenue
Alcoa Corp
AA stock chart compared to revenue
ATI Materials
ATI stock chart compared to revenue
Olin
OLN stock chart compared to revenue
Berry Global
BERY stock chart compared to revenue
Commercial Metals Co
CMC stock chart compared to revenue
NewMarket
NEU stock chart compared to revenue
Element Solutions
ESI stock chart compared to revenue
Sonoco Products Co
SON stock chart compared to revenue
Cabot
CBT stock chart compared to revenue
Westlake Chemical
WLK stock chart compared to revenue
Ashland Global Holdings
ASH stock chart compared to revenue
Mcewen Mining
MUX stock chart compared to revenue
Louisiana-Pacific
LPX stock chart compared to revenue
Sealed Air
SEE stock chart compared to revenue
Balchem
BCPC stock chart compared to revenue
Summit Materials
SUM stock chart compared to revenue
Huntsman
HUN stock chart compared to revenue
HB Fuller Co
FUL stock chart compared to revenue
Chemours Co
CC stock chart compared to revenue
Silgan Holdings
SLGN stock chart compared to revenue
Alpha Metallurgical Resources
AMR stock chart compared to revenue
Avient
AVNT stock chart compared to revenue
Carpenter Technology
CRS stock chart compared to revenue
Warrior Met Coal
HCC stock chart compared to revenue
Sensient Technologies
SXT stock chart compared to revenue
Scotts Miracle-Gro Co
SMG stock chart compared to revenue
Innospec
IOSP stock chart compared to revenue
Quaker Chemical
KWR stock chart compared to revenue
MP Materials
MP stock chart compared to revenue
Hecla Mining Co
HL stock chart compared to revenue
Arch Resources
ARCH stock chart compared to revenue
Materion
MTRN stock chart compared to revenue
Minerals Technologies
MTX stock chart compared to revenue
O-I Glass
OI stock chart compared to revenue
Sylvamo
SLVM stock chart compared to revenue
Tronox Holdings
TROX stock chart compared to revenue
Stepan Co
SCL stock chart compared to revenue
Kaiser Aluminum
KALU stock chart compared to revenue
Coeur Mining
CDE stock chart compared to revenue
Ingevity
NGVT stock chart compared to revenue
Orion Engineered Carbons Sa
OEC stock chart compared to revenue
TriMas
TRS stock chart compared to revenue
Hawkins
HWKN stock chart compared to revenue
Kronos Worldwide
KRO stock chart compared to revenue
Greif
GEF stock chart compared to revenue
Ecovyst
ECVT stock chart compared to revenue
Haynes International
HAYN stock chart compared to revenue
SunCoke Energy
SXC stock chart compared to revenue
Perimeter Solutions
PRM stock chart compared to revenue
Ryerson Holding
RYI stock chart compared to revenue
Koppers Holdings
KOP stock chart compared to revenue
Aspen Aerogels
ASPN stock chart compared to revenue
Century Aluminum
CENX stock chart compared to revenue
Metallus
MTUS stock chart compared to revenue
Mativ Holdings
MATV stock chart compared to revenue
Myers Industries
MYE stock chart compared to revenue
United States Lime and Minerals
USLM stock chart compared to revenue
Energy Fuels
UUUU stock chart compared to revenue
AdvanSix
ASIX stock chart compared to revenue
Pactiv Evergreen
PTVE stock chart compared to revenue
Clearwater Paper
CLW stock chart compared to revenue
Ramaco Resources
METC stock chart compared to revenue
Olympic Steel
ZEUS stock chart compared to revenue
Mercer International
MERC stock chart compared to revenue
Ranpak Holdings
PACK stock chart compared to revenue
LSB Industries
LXU stock chart compared to revenue
Radius Recycling
RDUS stock chart compared to revenue
Compass Minerals International
CMP stock chart compared to revenue
American Vanguard
AVD stock chart compared to revenue
Flotek Industries
FTK stock chart compared to revenue
Rayonier Advanced Materials
RYAM stock chart compared to revenue
Intrepid Potash
IPI stock chart compared to revenue
FutureFuel
FF stock chart compared to revenue
Universal Stainless and Alloy Prod
USAP stock chart compared to revenue
Mesabi Trust
MSB stock chart compared to revenue
Piedmont Lithium
PLL stock chart compared to revenue
Smith-Midland
SMID stock chart compared to revenue
Core Molding Technologies
CMT stock chart compared to revenue
Trinseo
TSE stock chart compared to revenue
Northern Technologies International
NTIC stock chart compared to revenue
Friedman Industries
FRD stock chart compared to revenue
Arq
ARQ stock chart compared to revenue
Golden Minerals Co
AUMN stock chart compared to revenue
Danimer Scientific
DNMR stock chart compared to revenue
Trilogy Metals
TMQ stock chart compared to revenue
Ampco-Pittsburgh
AP stock chart compared to revenue
Gold Resource
GORO stock chart compared to revenue
Flexible Solutions International
FSI stock chart compared to revenue
Comstock Mining
LODE stock chart compared to revenue
TOMI Environmental Solutions
TOMZ stock chart compared to revenue
VerifyMe
VRME stock chart compared to revenue
Cyclo Therapeutics
CYTH stock chart compared to revenue
Industrials ETF
XLI stock chart compared to revenue
Technology ETF
XLK stock chart compared to revenue
Staples ETF
XLP stock chart compared to revenue
Utilities ETF
XLU stock chart compared to revenue
Health Care ETF
XLV stock chart compared to revenue
Consumer Discretionary ETF
XLY stock chart compared to revenue
Oil & Gas ETF
XOP stock chart compared to revenue

Companies With Insider Buying

Greif
Executive VP & General Counsel
GEF stock chart compared to revenue
VerifyMe
Director
VRME stock chart compared to revenue