Industrials › Motors And Generators

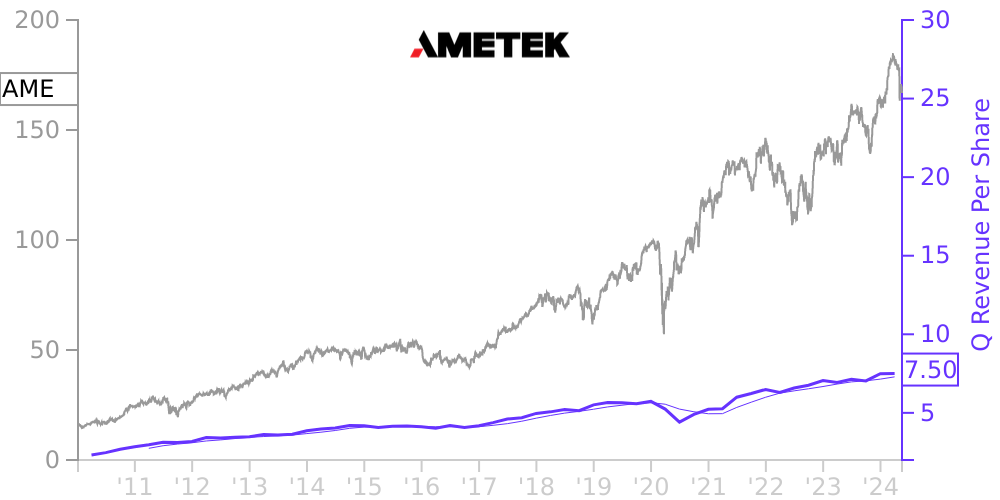
AME Stock Price Correlated With AMETEK Financials
External Links ⌄
Income Statement
Cash Flow
Balance Sheet
AME Income Statement
Enable JavaScript and reload
Revenue, Net:
Cost of Goods & Services Sold:
Gross Profit:
Selling, General & Admin Expense:
Research & Development Expense:
Total Operating Expenses:
Operating Income:
Income Taxes:
Net Income:
AME Cash Flow
Enable JavaScript and reload
Operating Activities Net Income:
Depreciation, Depletion & Amortization:
Change in Accounts Receiveable:
Net Cash from Operations:
Repurchases/Buybacks Common Stock:
Issuance of Long-term Debt:
Cash Dividends Paid:
Net Cash from Financing Activities:
Property, Plant & Equipment Purchases:
Purchases of Businesses, Net of Cash:
Net Cash from Investing Activities:
Net Change in Cash & Equivalents:
AME Balance Sheet
Enable JavaScript and reload
Cash and Cash Equivalents:
Short-Term Investments:
Accounts Receivable, Net:
Inventories:
Total Current Assets:
Property, Plant & Equipment, Net:
Total Assets:
Accounts Payable:
Current Portion of Long-Term Debt:
Total Short-Term Liabilities:
Long Term Debt, Non-Current Portion:
Total Long-Term Liabilities:
Total Liabilities:
COMPANY PROFILE
Basis of PresentationThe accompanying consolidated financial statements are unaudited. AMETEK, Inc. (the “Company”) believes that all adjustments (which primarily consist of normal recurring accruals) necessary for a fair presentation of the consolidated financial position of the Company at March 31, 2022, the consolidated results of its operations for the three months ended March 31, 2022 and 2021 and its cash flows for the three months ended March 31, 2022 and 2021 have been included. Quarterly results of operations are not necessarily indicative of results for the full year. The accompanying consolidated financial statements should be read in conjunction with the audited consolidated financial statements and related notes presented in the Company’s Annual Report on Form 10-K for the year ended December 31, 2021 as filed with the U.S. Securities and Exchange Commission.
Free historical financial statements for AMETEK Inc.. See how revenue, income, cash flow, and balance sheet financials have changed over 65 quarters since 2010. Compare with AME stock chart to see long term trends.
Data imported from AMETEK Inc. SEC filings. Check original filings before making any investment decision.