Energy › Crude Petroleum And Natural Gas

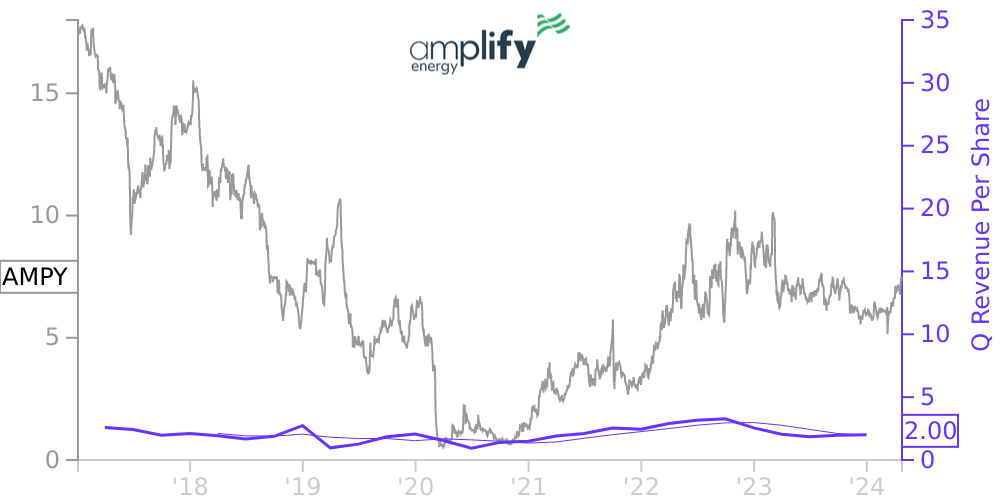
AMPY Stock Price Correlated With Amplify Energy Financials
External Links ⌄
Income Statement
Cash Flow
Balance Sheet
AMPY Income Statement
Enable JavaScript and reload
Revenue, Net:
Cost of Goods & Services Sold:
Gross Profit:
Selling, General & Admin Expense:
Research & Development Expense:
Total Operating Expenses:
Operating Income:
Income Taxes:
Net Income:
AMPY Cash Flow
Enable JavaScript and reload
Operating Activities Net Income:
Depreciation, Depletion & Amortization:
Change in Accounts Receiveable:
Net Cash from Operations:
Repurchases/Buybacks Common Stock:
Issuance of Long-term Debt:
Cash Dividends Paid:
Net Cash from Financing Activities:
Property, Plant & Equipment Purchases:
Purchases of Businesses, Net of Cash:
Net Cash from Investing Activities:
Net Change in Cash & Equivalents:
AMPY Balance Sheet
Enable JavaScript and reload
Cash and Cash Equivalents:
Short-Term Investments:
Accounts Receivable, Net:
Inventories:
Total Current Assets:
Property, Plant & Equipment, Net:
Total Assets:
Accounts Payable:
Current Portion of Long-Term Debt:
Total Short-Term Liabilities:
Long Term Debt, Non-Current Portion:
Total Long-Term Liabilities:
Total Liabilities:
COMPANY PROFILE
Note 1. Organization and Basis of Presentation General Amplify Energy Corp. (“Amplify Energy” or the “Company”), is a publicly traded Delaware corporation, in which our common stock is listed on the NYSE under the symbol “AMPY.” The Company operates in one reportable segment engaged in the acquisition, development, exploitation and production of oil and natural gas properties. The Company’s management evaluates performance based on one reportable business segment as there are not different economic environments within the operation of our oil and natural gas properties. The Company assets consist primarily of producing oil and natural gas properties located in Oklahoma, the Rockies, federal waters offshore Southern California, East Texas/North Louisiana and the Eagle Ford. Most of the Company’s oil and natural gas properties are located in large, mature oil and natural gas reservoirs. The Company’s properties consist primarily of operated and non-operated working interests in producing and undeveloped leasehold acreage and working interests in identified producing wells. Basis of Presentation Material intercompany transactions and balances have been eliminated in preparation of the Company’s Consolidated Financial Statements. The accompanying Consolidated Financial Statements have been prepared in accordance with accounting principles generally accepted in the United States of America (“GAAP”). Market Conditions and COVID-19 In March 2020, the World Health Organization classified the outbreak of COVID 19 as a global pandemic. In attempting to control the spread of COVID 19, governments around the world imposed laws and regulations such as shelter-in-place orders, quarantines, executive orders and similar restrictions. As a result, the global economy suffered a significant slowdown and uncertainty, which in turn led to a precipitous decline in commodity prices in response to decreased demand. Beginning in the first quarter of 2021 and continuing throughout the year, commodity prices have recovered substantially, due in part to the accessibility of vaccines, reopening of economies after lockdowns, and general optimism concerning the spread and severity of new variants of COVID-19 and the economic recovery. Despite recent downward trends in the spread of COVID-19, particularly as vaccination rates have increased, new variants of COVID-19 have intermittently emerged and spread throughout the U.S. and globally causing further uncertainty. This continued uncertainty and/or the emergence of new COVID 19 variant, including vaccine resistant variant, may result in additional adverse impacts on our results of operations, cash flows and financial position. Paycheck Protection Program. On June 22, 2021, KeyBank National Association (“KeyBank”) notified the Company that the loan under the Paycheck Protection Program (the “PPP Loan”) had been approved for full and complete forgiveness by the Small Business Association. For the year ended December 31, 2021, the Company reported a gain on extinguishment of debt for $5.5 million for the PPP Loan forgiveness in the Consolidated Statements of Operations. See Note 8 for additional information. Employee Retention Credit. The Consolidated Appropriations Act extended and expanded the availability of the Coronavirus Aid, Relief, and Economic Security Act (the “CARES Act”) employee retention credit through September 30, 2021. Subsequently, the American Rescue Plan Act of 2021 (the “ARP Act”), enacted on March 11, 2021, extended and expanded the availability of the employee retention credit through December 31, 2021, however, certain provisions applied only after December 31, 2020. This new legislation expanded the group of qualifying businesses to include businesses with fewer than 500 employees and those who previously qualified for the PPP Loan. The employee retention credit is calculated to be equal to 70% of qualified wages paid to employees after December 31, 2020, and before January 1, 2022. Dur
Free historical financial statements for Amplify Energy Corp. See how revenue, income, cash flow, and balance sheet financials have changed over 37 quarters since 2017. Compare with AMPY stock chart to see long term trends.
Data imported from Amplify Energy Corp SEC filings. Check original filings before making any investment decision.