Industrials › Construction Special Trade Contractors

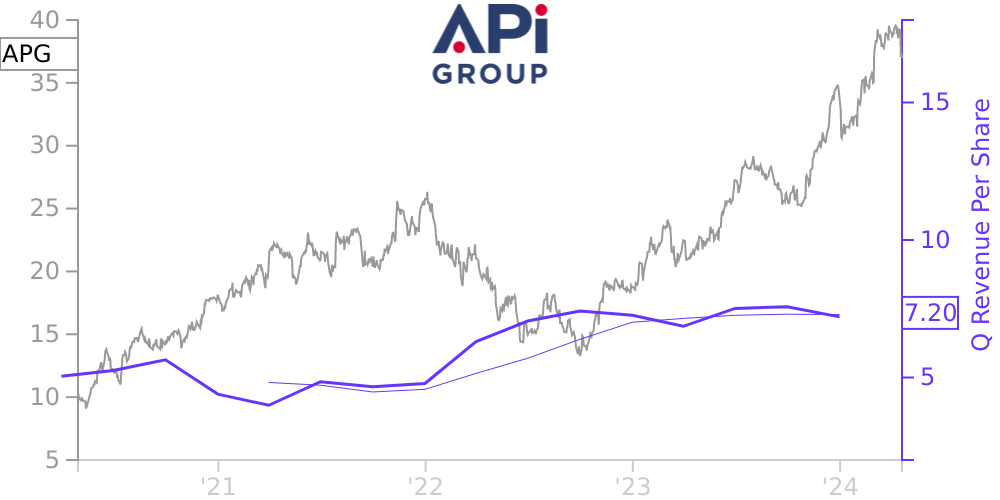
APG Stock Price Correlated With API Financials
External Links ⌄
Income Statement
Cash Flow
Balance Sheet
APG Income Statement
Enable JavaScript and reload
Revenue, Net:
Cost of Goods & Services Sold:
Gross Profit:
Selling, General & Admin Expense:
Research & Development Expense:
Total Operating Expenses:
Operating Income:
Income Taxes:
Net Income:
APG Cash Flow
Enable JavaScript and reload
Operating Activities Net Income:
Depreciation, Depletion & Amortization:
Change in Accounts Receiveable:
Net Cash from Operations:
Repurchases/Buybacks Common Stock:
Issuance of Long-term Debt:
Cash Dividends Paid:
Net Cash from Financing Activities:
Property, Plant & Equipment Purchases:
Purchases of Businesses, Net of Cash:
Net Cash from Investing Activities:
Net Change in Cash & Equivalents:
APG Balance Sheet
Enable JavaScript and reload
Cash and Cash Equivalents:
Short-Term Investments:
Accounts Receivable, Net:
Inventories:
Total Current Assets:
Property, Plant & Equipment, Net:
Total Assets:
Accounts Payable:
Current Portion of Long-Term Debt:
Total Short-Term Liabilities:
Long Term Debt, Non-Current Portion:
Total Long-Term Liabilities:
Total Liabilities:
COMPANY PROFILE
NOTE 2. BASIS OF PRESENTATION AND SIGNIFICANT ACCOUNTING POLICIES Principles of consolidation The accompanying interim unaudited condensed consolidated financial statements (the “Interim Statements”) include the accounts of the Company and of its wholly-owned subsidiaries. All significant intercompany accounts and transactions have been eliminated in consolidation. These Interim Statements have been prepared pursuant to the rules and regulations of the U.S. Securities and Exchange Commission (“SEC”) and do not include all of the information and footnotes required by generally accepted accounting principles in the United States of America (“U.S. GAAP”) for complete financial statements. The condensed consolidated balance sheets as of December 31, 2021 were derived from audited financial statements for the year then ended but do not include all of the information and footnotes required by U.S. GAAP with respect to annual financial statements. In the opinion of management, the Interim Statements include all adjustments (including normal recurring accruals) necessary for a fair presentation of the Company’s consolidated financial position, results of operations and cash flows for the dates and periods presented. It is recommended that these Interim Statements be read in conjunction with the Company’s audited annual consolidated financial statements and accompanying footnotes thereto for the year ended December 31, 2021 . Results for interim periods are not necessarily indicative of the results to be expected for a full fiscal year or for any future period.
Resegmentation The Company has combined the leadership responsibility and full accountability for the Industrial Services and Specialty Services operating segments. As a result, beginning with the three months ended March 31, 2022, the information for the Industrial Services segment is combined with the Specialty Services segment and the Company presents financial information for the Safety Services and Specialty Services segments, the two operating segments and also the reportable segments. The Company's chief operating decision maker regularly reviews financial information to allocate resources and assess performance utilizing these reorganized segments. Certain prior year amounts have been recast to conform to the current year presentation. Throughout these Interim Statements, unless otherwise indicated, amounts and activity reflect reclassifications related to the Company's resegmentation, as described in Note 20 - "Segment Information."
Cash, cash equivalents, and restricted cash The Company considers all highly liquid investments purchased with an original maturity date of three months or less to be cash equivalents. Restricted cash is reported as current restricted cash and other assets in the condensed consolidated balance sheets. Restricted cash reflects collateral against certain bank guarantees and amounts held in escrow as described in Note 11 - "Debt".
Investments The Company holds investments in joint ventures which are accounted for under the equity method of accounting as the Company does not exercise control over the joint ventures. The Company’s share of earnings from the joint ventures w as less than $ 1 and $ 1 d uring the three months ended March 31, 2022 and 2021, respectively. The earnings are recorded w ithin investment income and other, net in the condensed consolidated statements of operations. The investment balances were $ 3 and $ 4 as of March 31, 2022 and December 31, 2021, respectively, and are recorded within other assets in the condensed consolidated balance sheets.
Pension and post-retirement obligations The Company's accounting policies related to pension and post-retirement obligations are disclosed in Note 14 - "Pension".
Free historical financial statements for API Group Corp.. See how revenue, income, cash flow, and balance sheet financials have changed over 25 quarters since 2020. Compare with APG stock chart to see long term trends.
Data imported from API Group Corp. SEC filings. Check original filings before making any investment decision.