Technology › Electronic Connectors

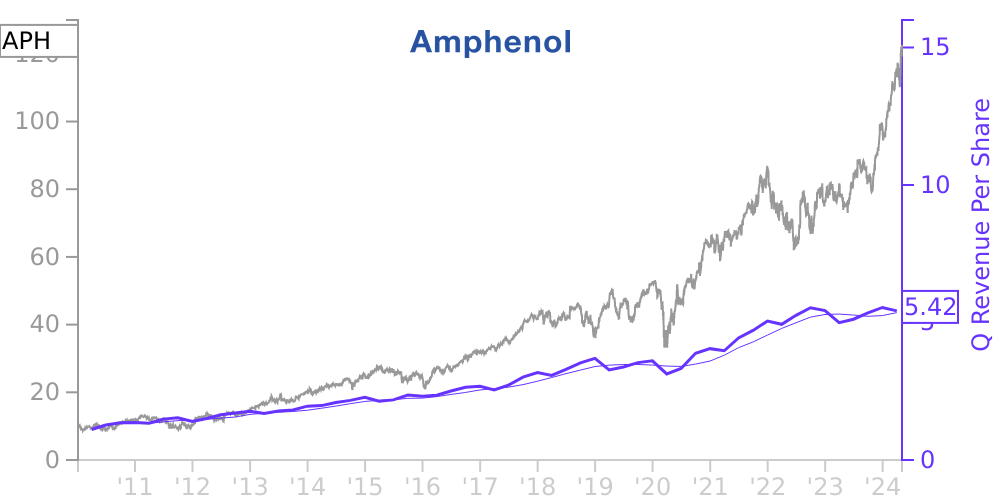
APH Stock Price Correlated With Amphenol Financials
External Links ⌄
Income Statement
Cash Flow
Balance Sheet
APH Income Statement
Enable JavaScript and reload
Revenue, Net:
Cost of Goods & Services Sold:
Gross Profit:
Selling, General & Admin Expense:
Research & Development Expense:
Total Operating Expenses:
Operating Income:
Income Taxes:
Net Income:
APH Cash Flow
Enable JavaScript and reload
Operating Activities Net Income:
Depreciation, Depletion & Amortization:
Change in Accounts Receiveable:
Net Cash from Operations:
Repurchases/Buybacks Common Stock:
Issuance of Long-term Debt:
Cash Dividends Paid:
Net Cash from Financing Activities:
Property, Plant & Equipment Purchases:
Purchases of Businesses, Net of Cash:
Net Cash from Investing Activities:
Net Change in Cash & Equivalents:
APH Balance Sheet
Enable JavaScript and reload
Cash and Cash Equivalents:
Short-Term Investments:
Accounts Receivable, Net:
Inventories:
Total Current Assets:
Property, Plant & Equipment, Net:
Total Assets:
Accounts Payable:
Current Portion of Long-Term Debt:
Total Short-Term Liabilities:
Long Term Debt, Non-Current Portion:
Total Long-Term Liabilities:
Total Liabilities:
COMPANY PROFILE
Amphenol Corporation is one of the world’s largest designers, manufacturers and marketers of electrical, electronic and fiber optic connectors and interconnect systems, antennas, sensors and sensor-based products and coaxial and high-speed specialty cable. The Company sells its products to customers worldwide. Through December 31, 2021, the Company operated through two reportable business segments:
● Interconnect Products and Assemblies – The Interconnect Products and Assemblies segment primarily designed, manufactured and marketed a broad range of connector and connector systems, value-add products and other products, including antennas and sensors, used in a broad range of applications in a diverse set of end markets.
● Cable Products and Solutions – The Cable Products and Solutions segment primarily designed, manufactured and marketed cable, value-add products and components for use primarily in the broadband communications and information technology markets, as well as certain applications in other markets.
Effective January 1, 2022, the Company aligned its businesses into three newly formed reportable business segments:
(i) Harsh Environment Solutions,
(ii) Communications Solutions and
(iii) Interconnect and Sensor Systems .
Free historical financial statements for Amphenol Corp. See how revenue, income, cash flow, and balance sheet financials have changed over 65 quarters since 2010. Compare with APH stock chart to see long term trends.
Data imported from Amphenol Corp SEC filings. Check original filings before making any investment decision.