
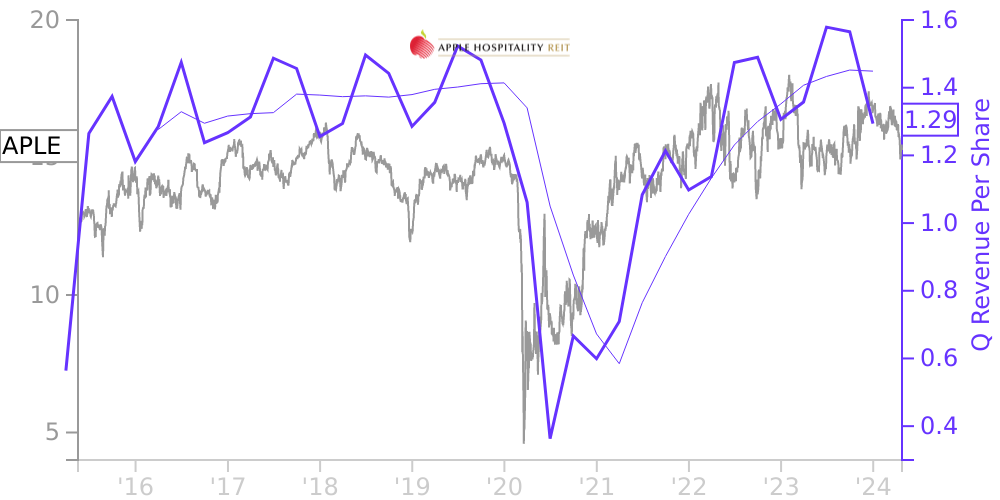
APLE Stock Price Correlated With Apple Hospitality REIT Financials
External Links ⌄
Income Statement
Cash Flow
Balance Sheet
APLE Income Statement
Enable JavaScript and reload
Revenue, Net:
Cost of Goods & Services Sold:
Gross Profit:
Selling, General & Admin Expense:
Research & Development Expense:
Total Operating Expenses:
Operating Income:
Income Taxes:
Net Income:
APLE Cash Flow
Enable JavaScript and reload
Operating Activities Net Income:
Depreciation, Depletion & Amortization:
Change in Accounts Receiveable:
Net Cash from Operations:
Repurchases/Buybacks Common Stock:
Issuance of Long-term Debt:
Cash Dividends Paid:
Net Cash from Financing Activities:
Property, Plant & Equipment Purchases:
Purchases of Businesses, Net of Cash:
Net Cash from Investing Activities:
Net Change in Cash & Equivalents:
APLE Balance Sheet
Enable JavaScript and reload
Cash and Cash Equivalents:
Short-Term Investments:
Accounts Receivable, Net:
Inventories:
Total Current Assets:
Property, Plant & Equipment, Net:
Total Assets:
Accounts Payable:
Current Portion of Long-Term Debt:
Total Short-Term Liabilities:
Long Term Debt, Non-Current Portion:
Total Long-Term Liabilities:
Total Liabilities:
COMPANY PROFILE
Note 1
Organization and Summary of Significant Accounting Policies
Organization
Apple Hospitality REIT, Inc., formed in November 2007 as a Virginia corporation, together with its wholly-owned subsidiaries (the “Company”), is a self-advised real estate investment trust (“REIT”) that invests in income-producing real estate, primarily in the lodging sector, in the United States (“U.S.”). The Company’s fiscal year end is December 31. The Company has no foreign operations or assets and its operating structure includes only one reportable segment. The consolidated financial statements include the accounts of the Company and its subsidiaries. All intercompany accounts and transactions have been eliminated. Although the Company has interests in potential variable interest entities through its purchase commitments, it is not the primary beneficiary as the Company does not have any elements of power in the decision making process of these entities, and therefore does not consolidate the entities. As of December 31, 2021, the Company owned 219 hotels with an aggregate of 28,747 rooms located in 36 states. All information related to the number of rooms included in these notes to the consolidated financial statements and Schedule III - Real Estate and Accumulated Depreciation and Amortization listed in the Index at Item 15 has not been audited. The Company’s common shares are listed on the New York Stock Exchange (“NYSE”) under the ticker symbol “APLE.”
The Company has elected to be treated as a REIT for federal income tax purposes. The Company has a wholly-owned taxable REIT subsidiary (or subsidiaries thereof) (collectively, the “Lessee”), which leases all of the Company’s hotels.
Coronavirus COVID-19 Pandemic
As a result of the current coronavirus COVID-19 pandemic (“COVID-19”) and the impact it has had on travel and the broader economy throughout the U.S. since March 2020, the Company’s hotels have experienced significant declines in occupancy, which have had and are expected to continue to have a significant negative effect on the Company’s revenue and operating results. While occupancy has recovered significantly during 2021, there remains significant uncertainty as to when operations at the hotels will return to pre-pandemic levels.
Cash and Cash Equivalents
Cash and cash equivalents consist of highly liquid investments with original maturities of three months or less. The fair market value of cash and cash equivalents approximates their carrying value. Cash balances may at times exceed federal depository insurance limits.
Restricted Cash
Restricted cash includes reserves for debt service, real estate taxes, and insurance, and reserves for furniture, fixtures, and equipment replacements of up to 5% of property revenue for certain hotels, as required by certain management or mortgage debt agreement restrictions and provisions. The fair market value of restricted cash approximates its carrying value.
Investment in Real Estate and Related Depreciation and Amortization
Real estate is stated at cost, net of depreciation and amortization. Repair and maintenance costs are expensed as incurred while significant improvements, renovations, and replacements are capitalized. As further discussed in Note 10, finance ground lease assets are capitalized at the estimated present value of the remaining minimum lease payments under the leases. Depreciation and amortization are computed using the straight-line method over the average estimated useful lives of the assets, which are generally 39 years for buildings, the remaining life of the lease for finance ground leases (which in some instances may include renewal options), 10 to 20 years for franchise fees, 10 years for major improvements and three to seven years for furniture and equipment.
The Company considers expenditures to be capital in nature based on the following criteria: (1) for a single asset, the cost must be at least $500, including all normal and necessary costs to place the asset in
Free historical financial statements for Apple Hospitality REIT Inc. See how revenue, income, cash flow, and balance sheet financials have changed over 57 quarters since 2012. Compare with APLE stock chart to see long term trends.
Data imported from Apple Hospitality REIT Inc SEC filings. Check original filings before making any investment decision.