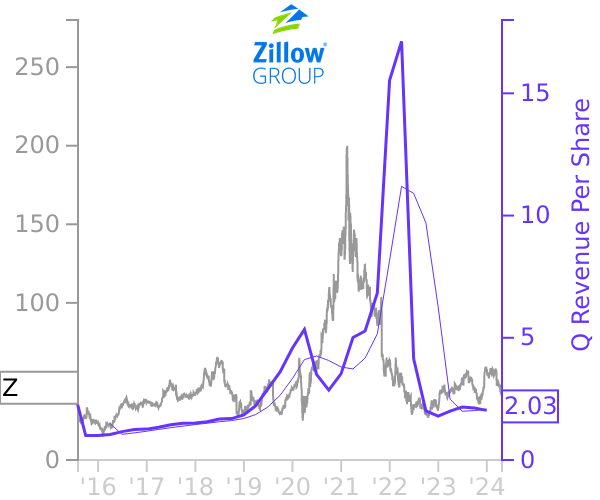
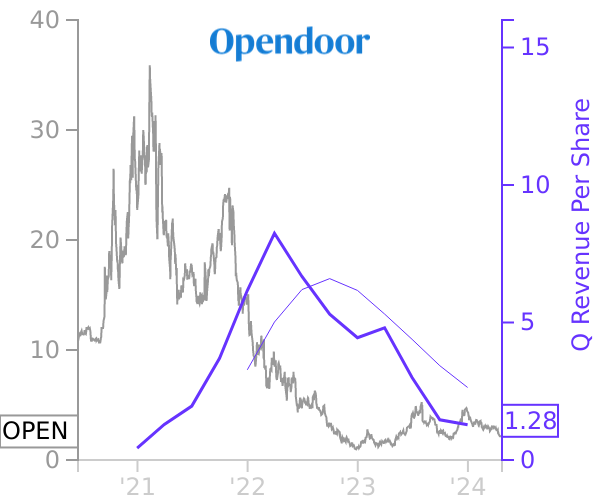
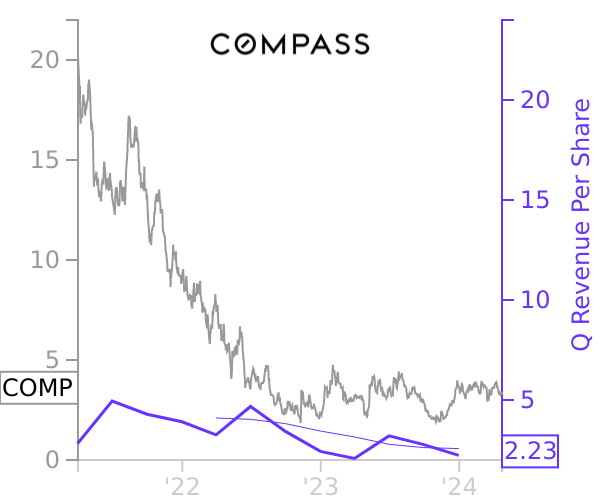
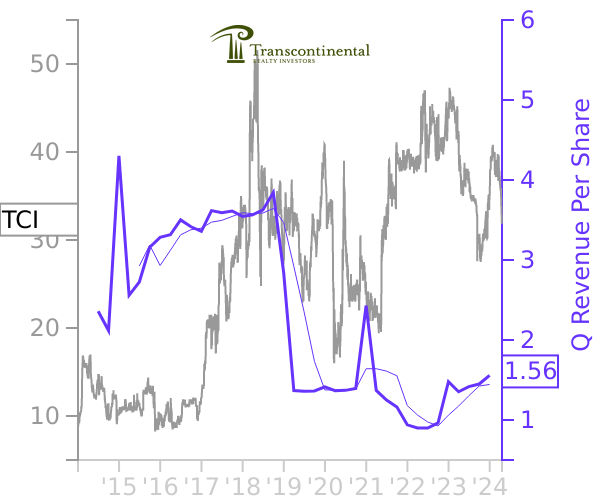
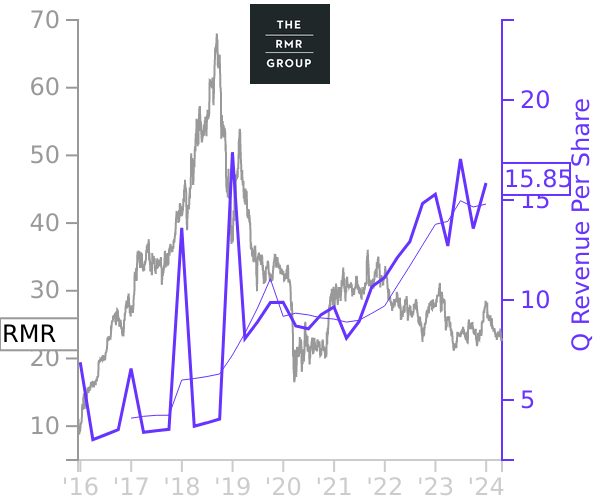
Real Estate Stock Prices vs Revenue
Quarterly revenue and earnings fluctuate like stock prices. Get the big picture with insights from company insiders and leading investors.
Recent Filings
Largest Companies
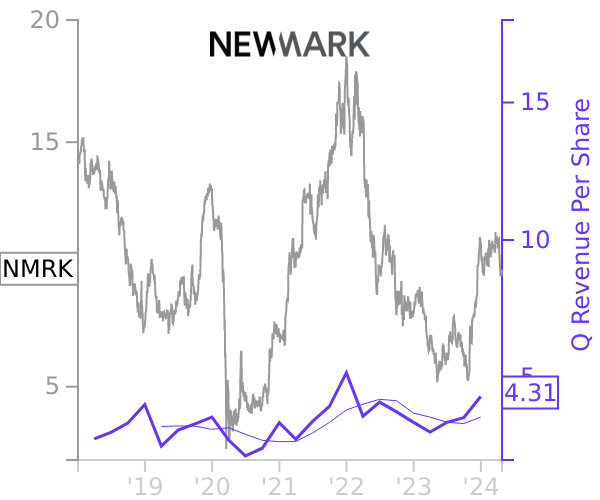
Insider Buying
Recent Real Estate Filings
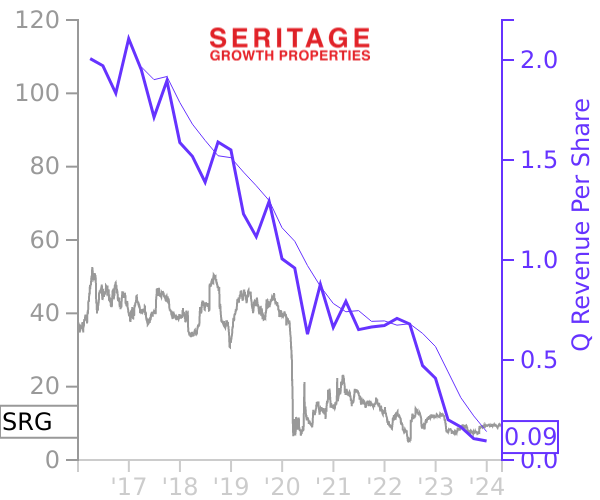
Net Lease REITs
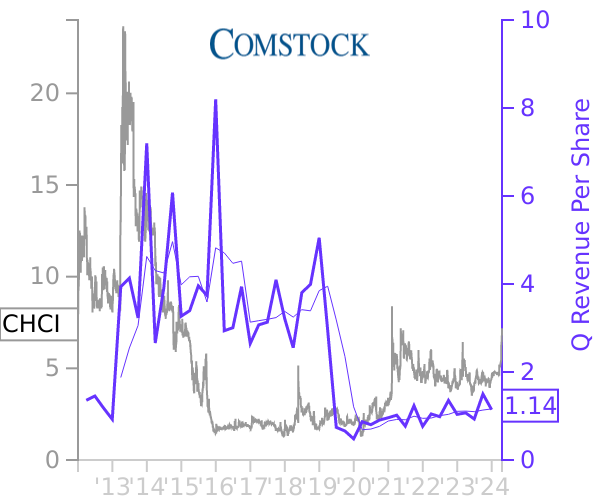
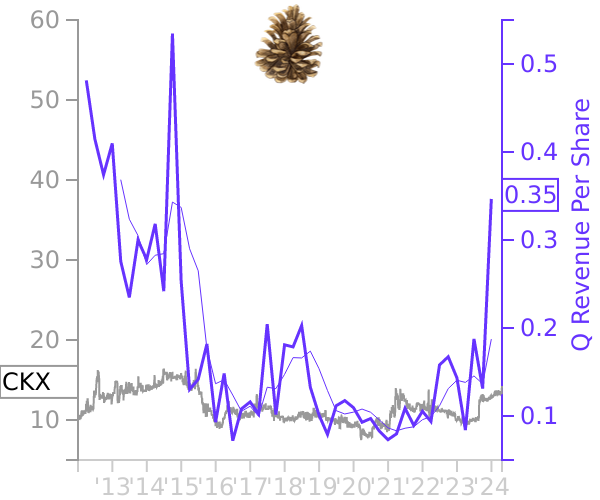
Seritage Growth Properties
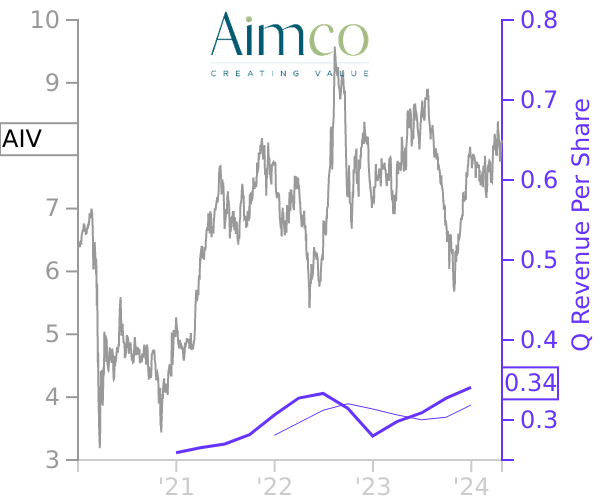
Apartment REITs
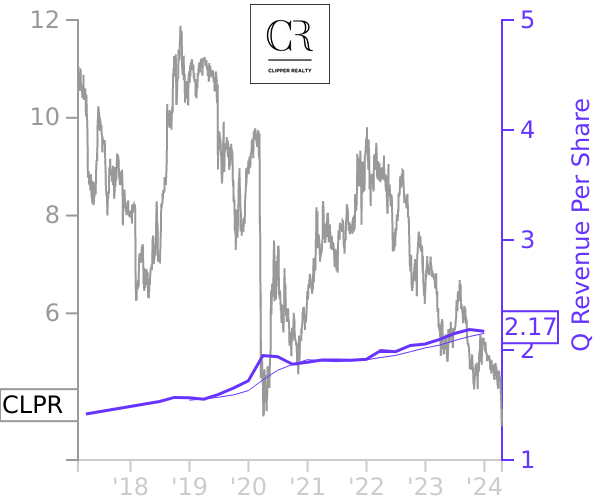
Clipper Realty
Regional Mall REITs
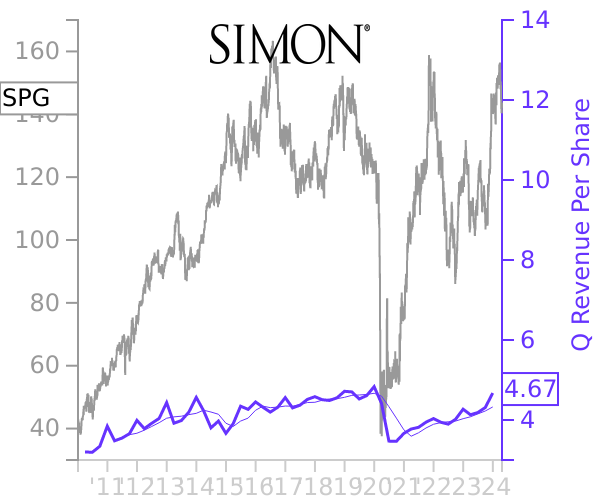
Simon Property
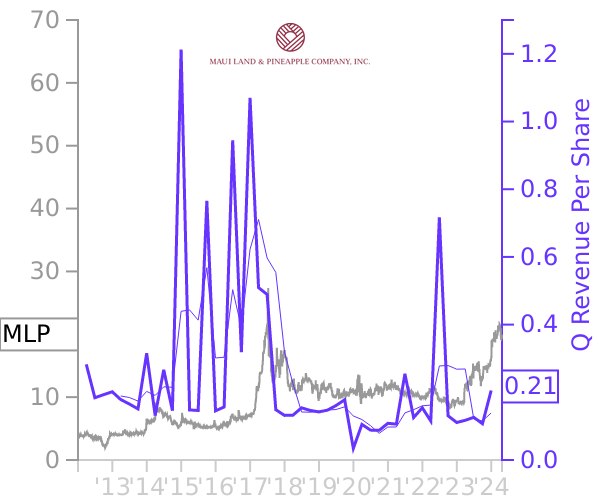
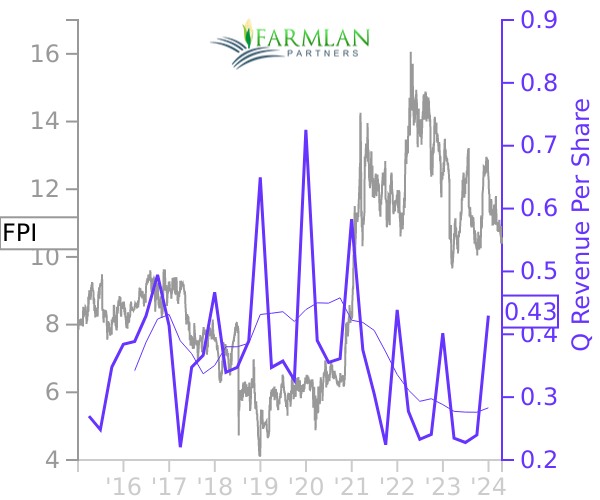
Farmland REITs
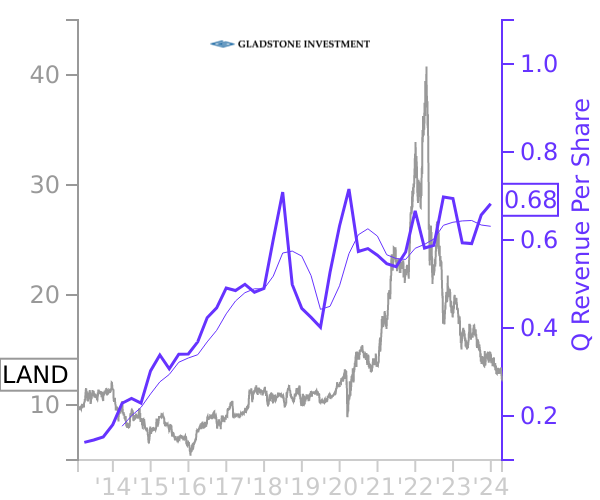
Gladstone Land
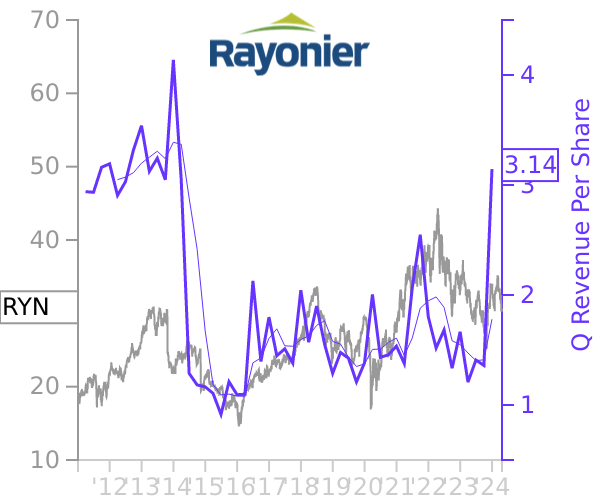
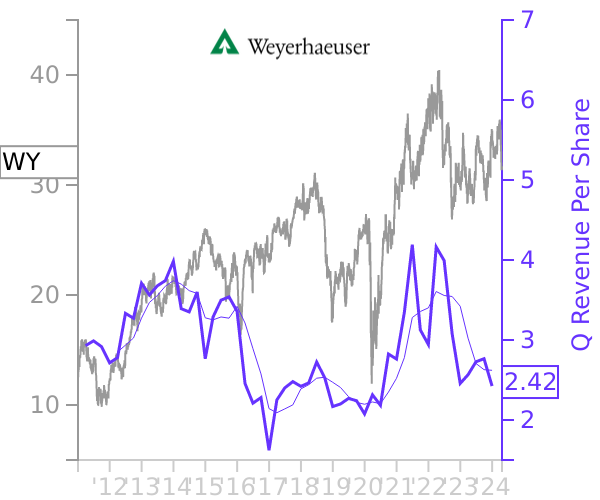
Timberland REITs
Rayonier
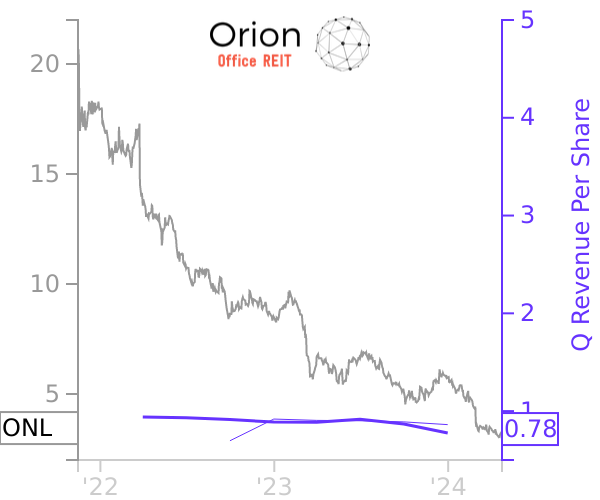
Office REITs
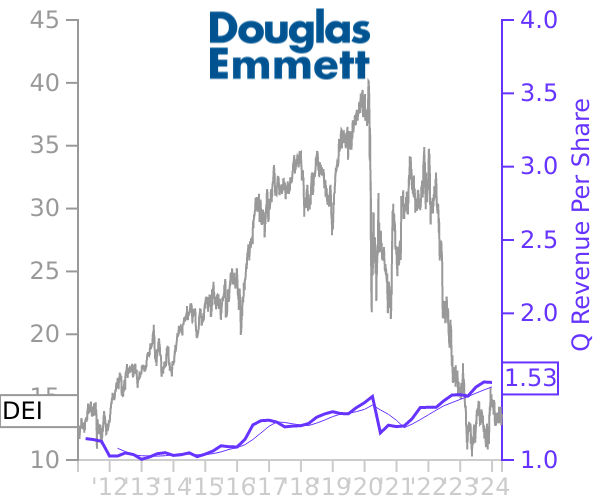
Douglas Emmett
Health Care REITs
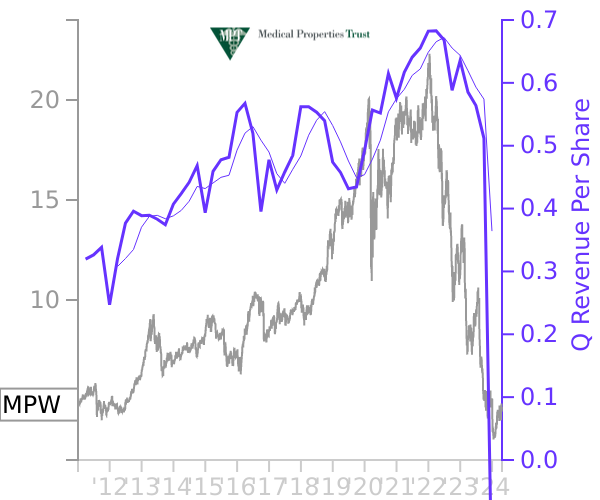
Medical Properties Trust
Billboard REITs
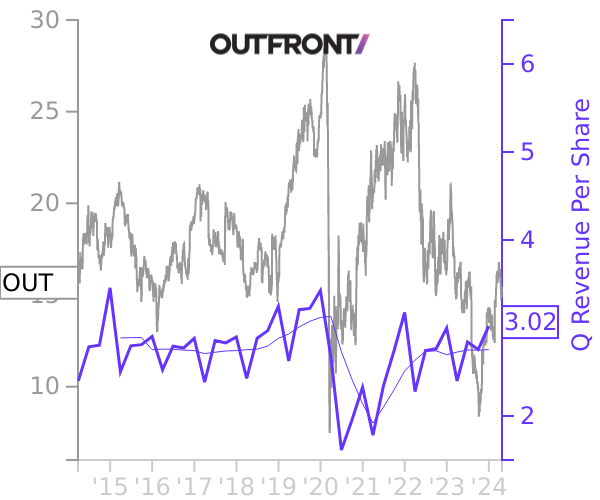
Outfront Media
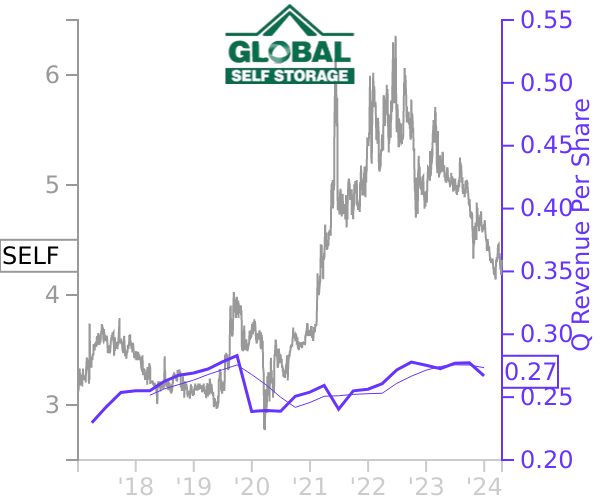
Self Storage REITs
Global Self Storage
Largest Market Caps
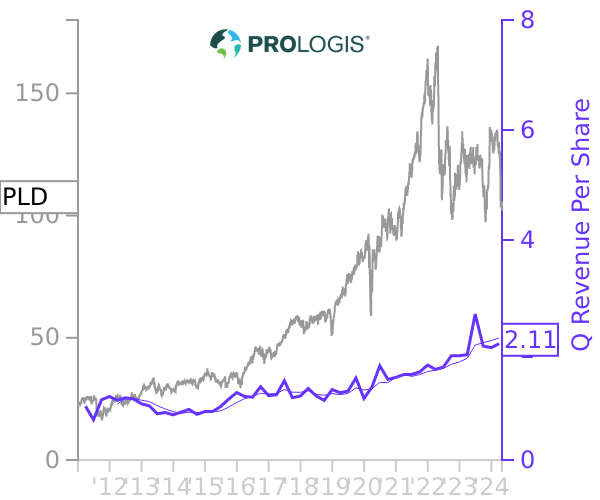
Industrial REITs
Prologis
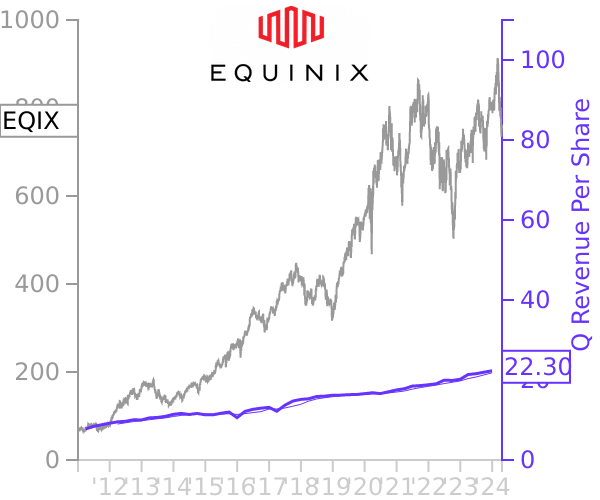
Data Center REITs
Equinix
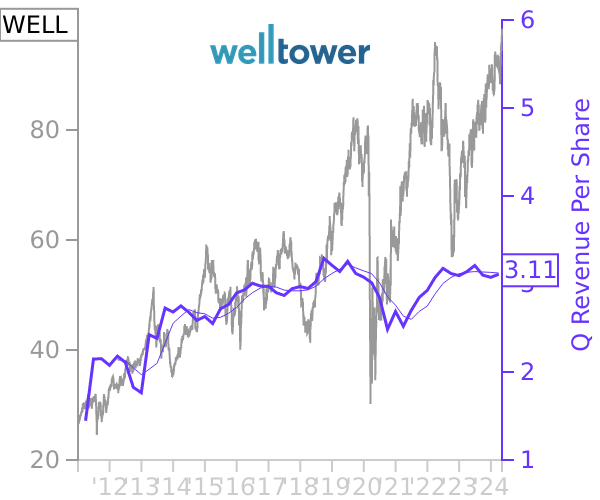
Health Care REITs
Welltower
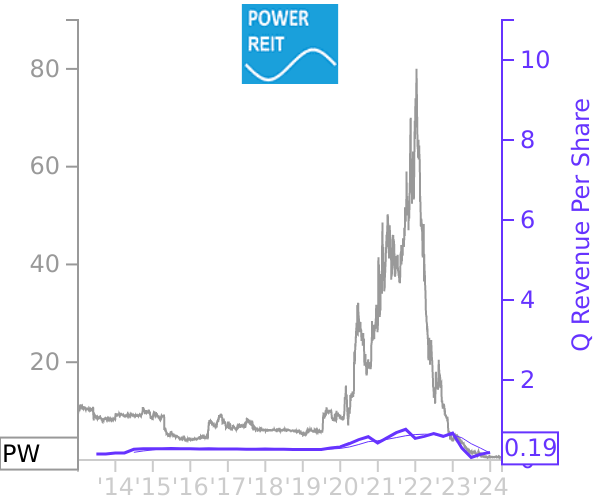
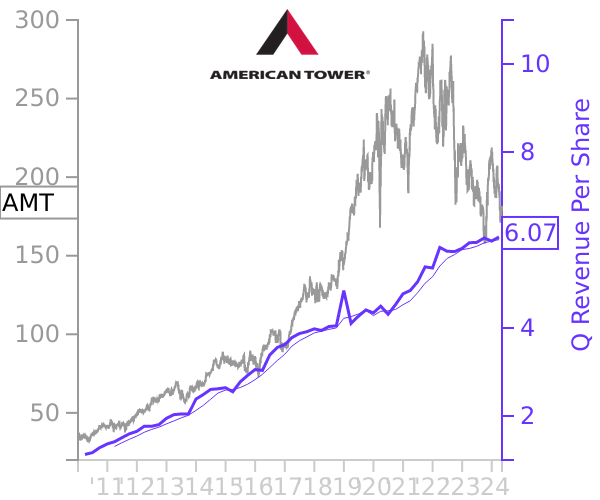
Infrastructure REITs
American Tower
Regional Mall REITs
Simon Property
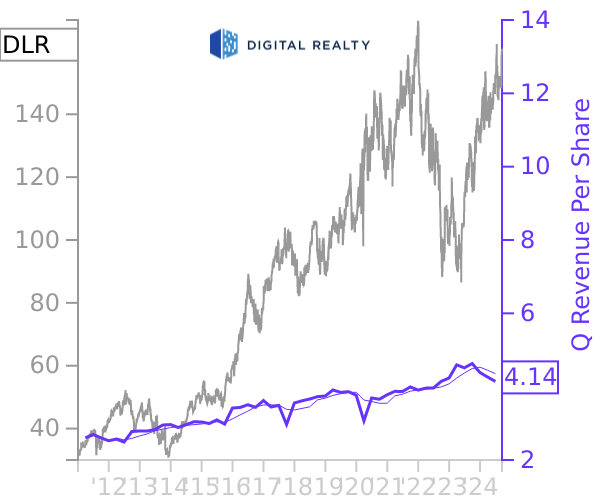
Data Center REITs
Digital Realty Trust
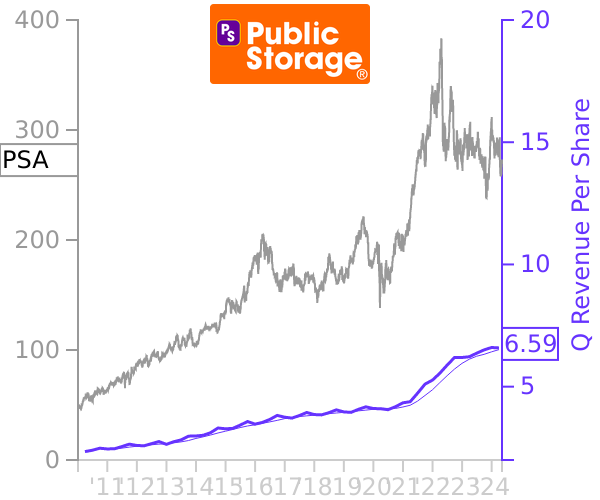
Self Storage REITs
Public Storage
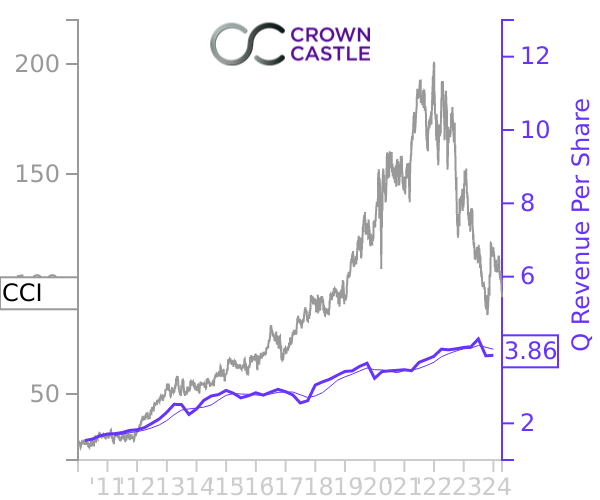
Infrastructure REITs
Crown Castle International
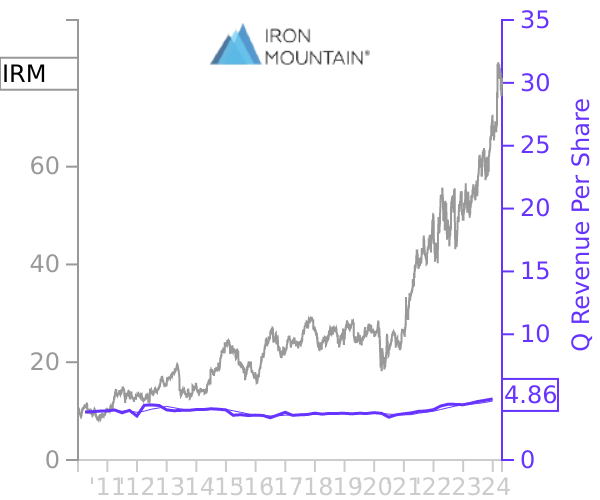
Data Center REITs
Iron Mountain
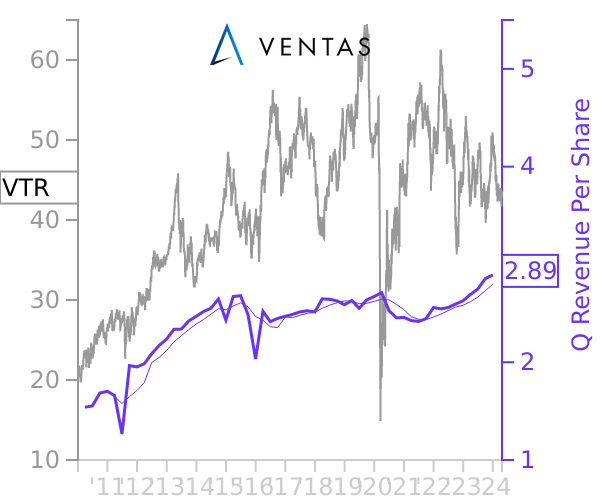
Health Care REITs
Ventas
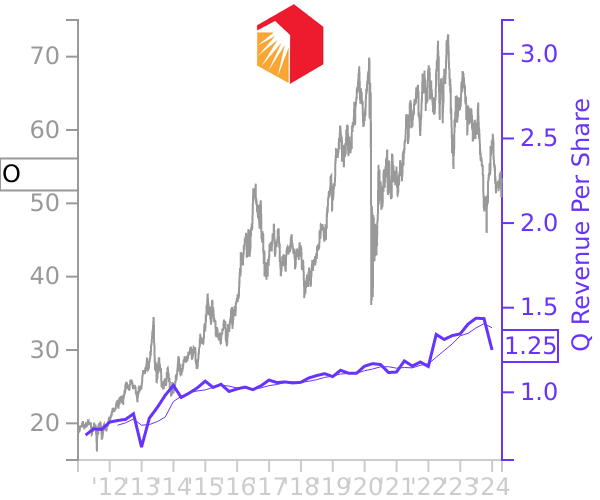
Net Lease REITs
Realty Income
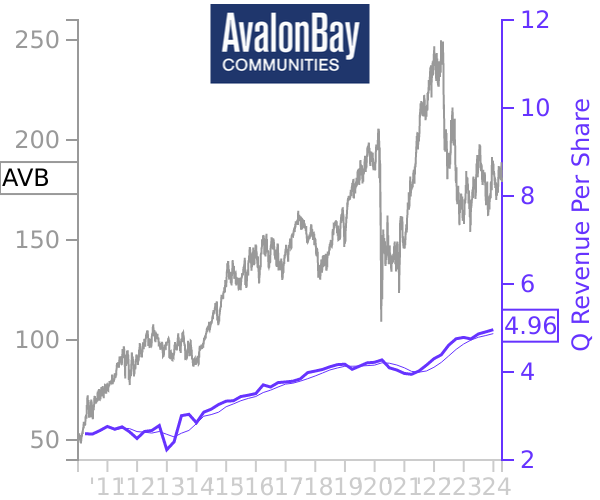
Apartment REITs
AvalonBay Communities
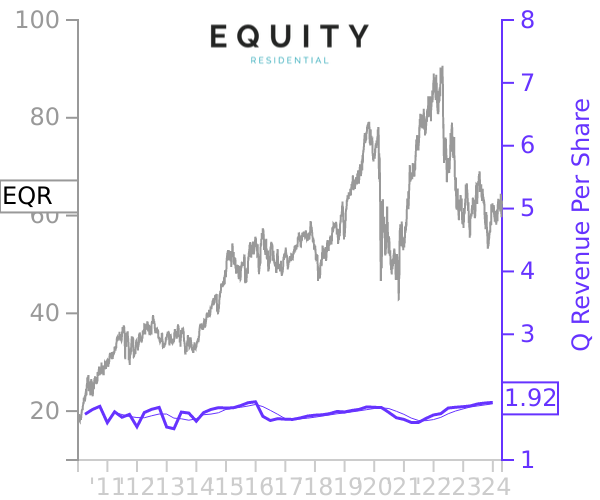
Apartment REITs
Equity Residential
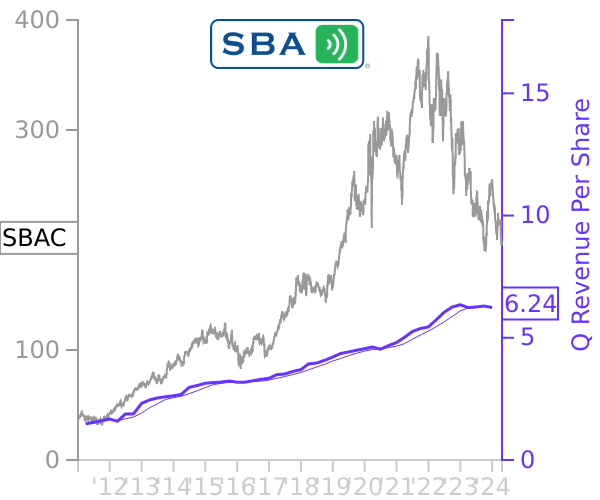
Infrastructure REITs
SBA Communications
Timberland REITs
Weyerhaeuser Co
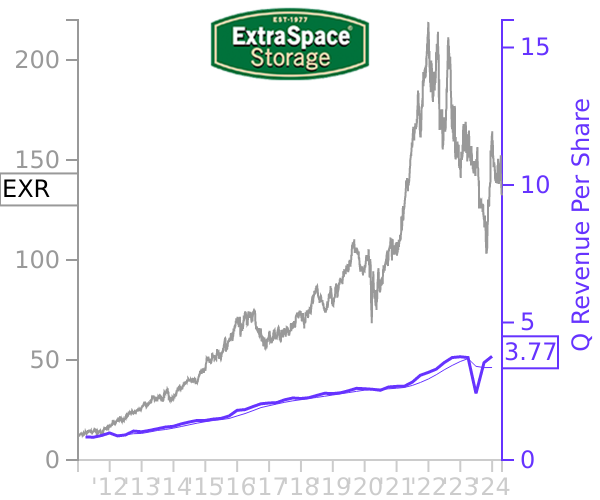
Self Storage REITs
Extra Space Storage
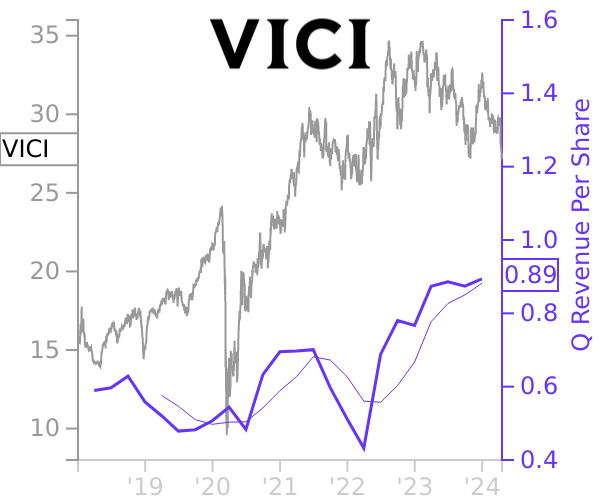
Net Lease REITs
VICI Properties
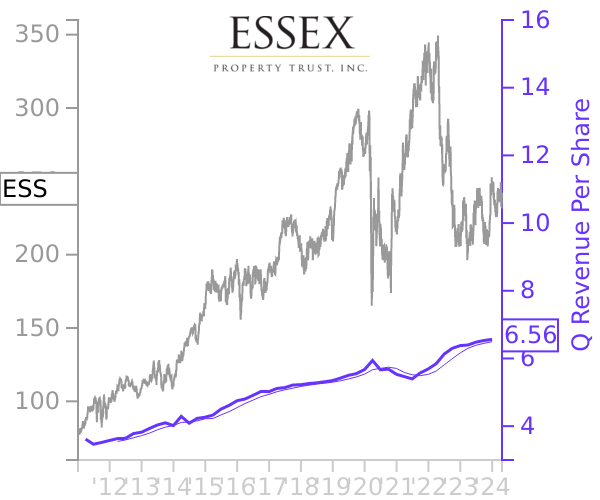
Apartment REITs
Essex Property Trust
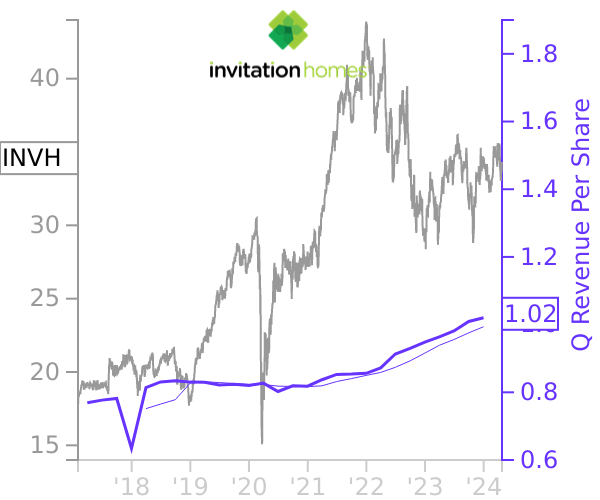
Single Family Housing REITs
Invitation Homes
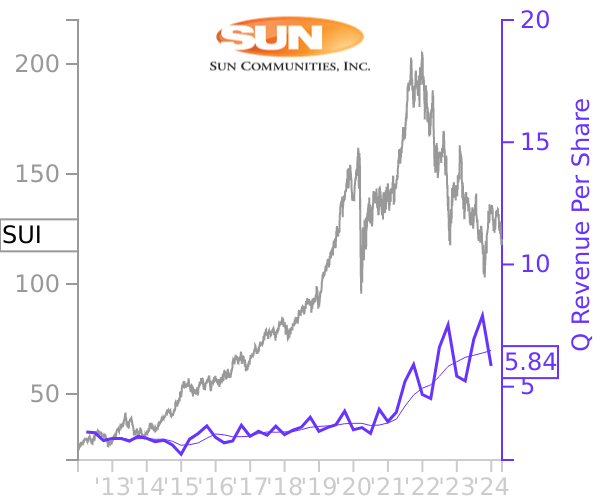
Manufactured Housing REITs
Sun Communities
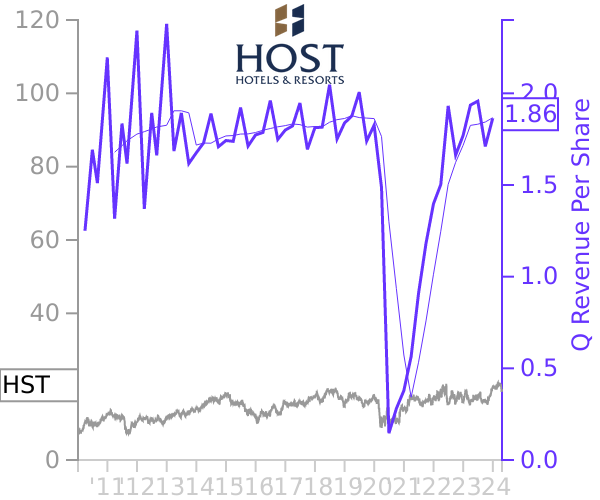
Hotel REITs
Host Hotels & Resorts
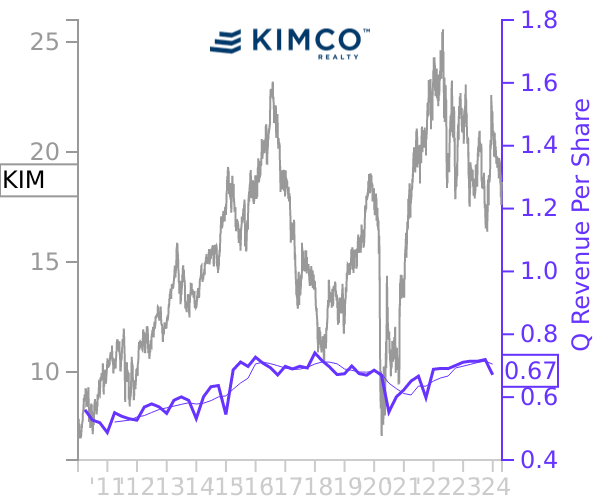
Shopping Center REITs
Kimco Realty
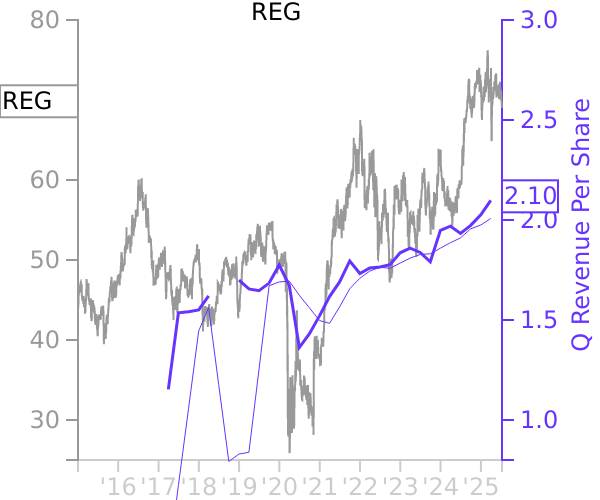
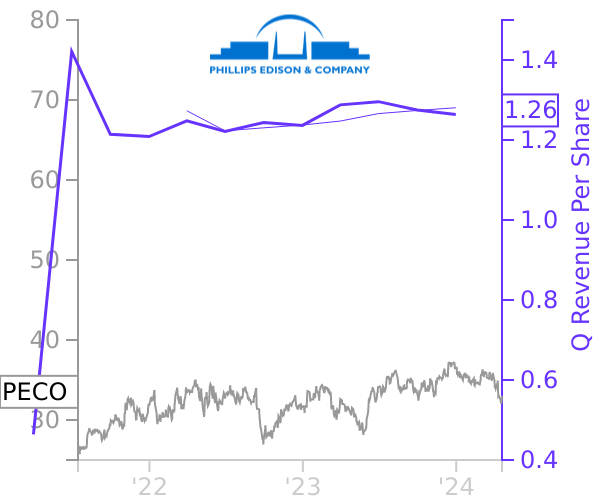
Shopping Center REITs
Regency Centers
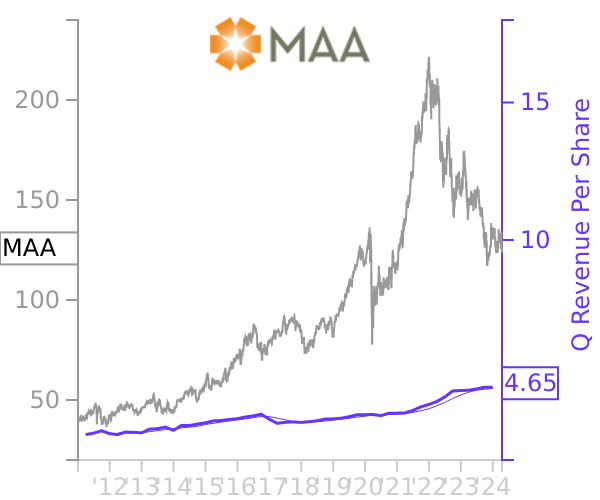
Apartment REITs
Mid-America Apartment Communities
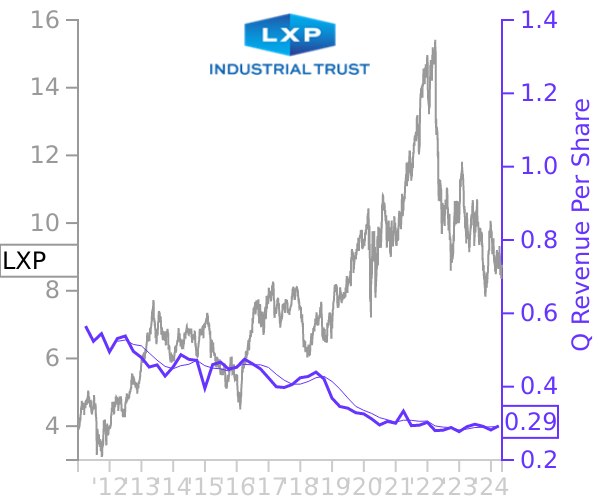
Industrial REITs
Lexington Realty Trust
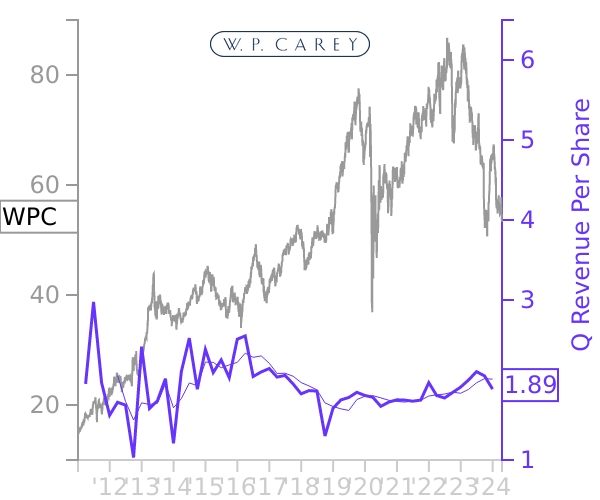
Net Lease REITs
WP Carey
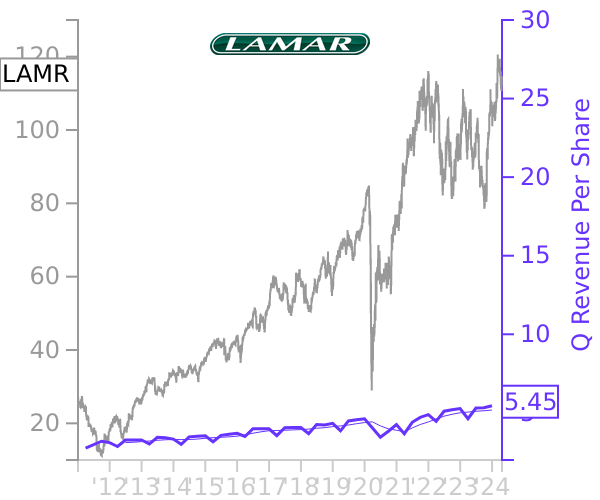
Billboard REITs
Lamar Advertising Co
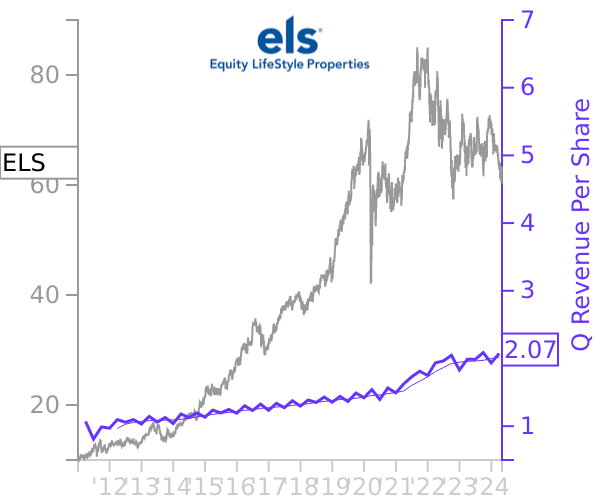
Manufactured Housing REITs
Equity LifeStyle Properties
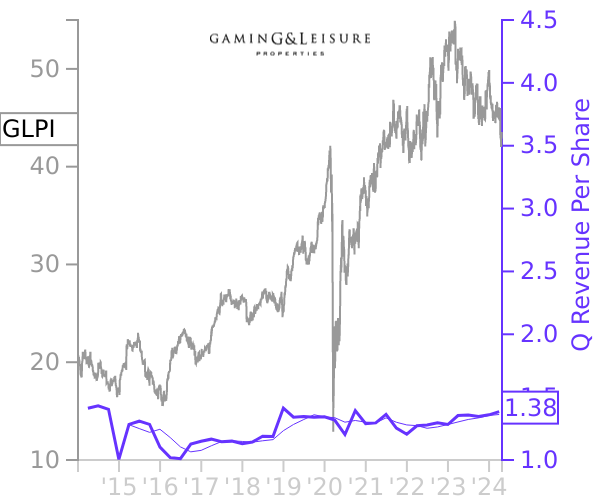
Net Lease REITs
Gaming and Leisure Properties
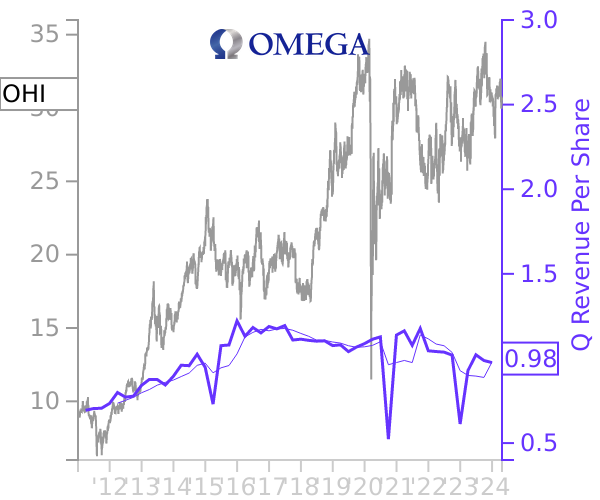
Health Care REITs
Omega Healthcare Investors
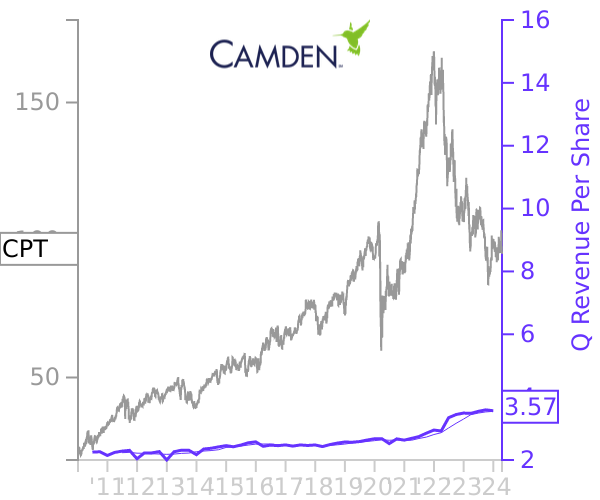
Apartment REITs
Camden Property Trust
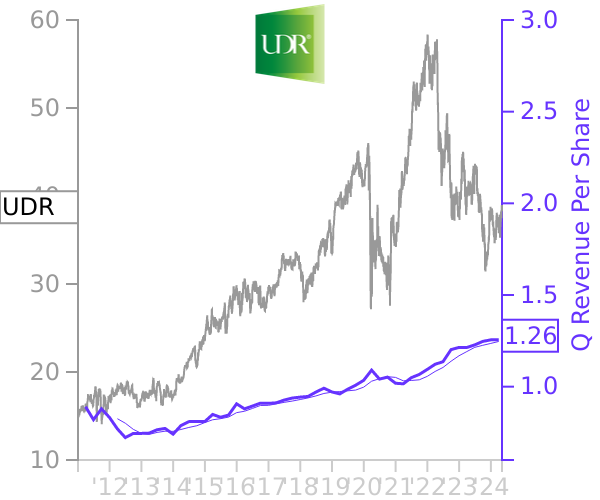
Apartment REITs
UDR
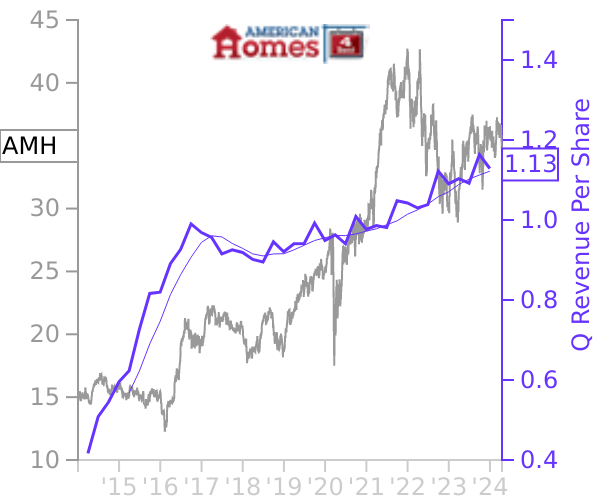
Single Family Housing REITs
American Homes 4 Rent
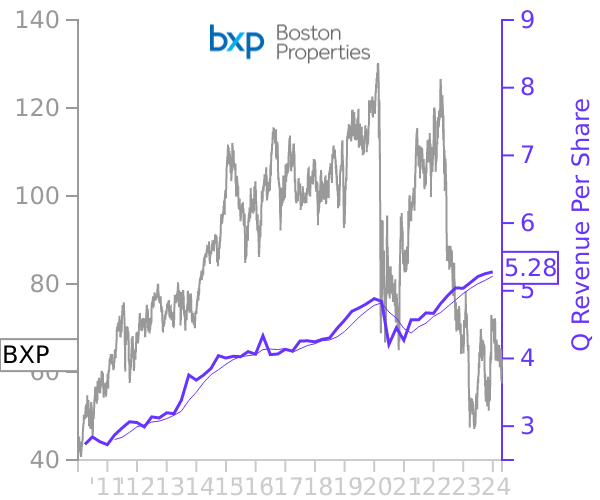
Office REITs
Boston Properties
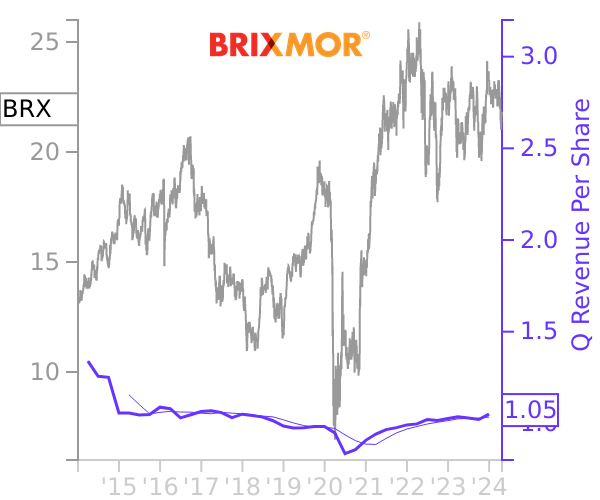
Shopping Center REITs
Brixmor Property
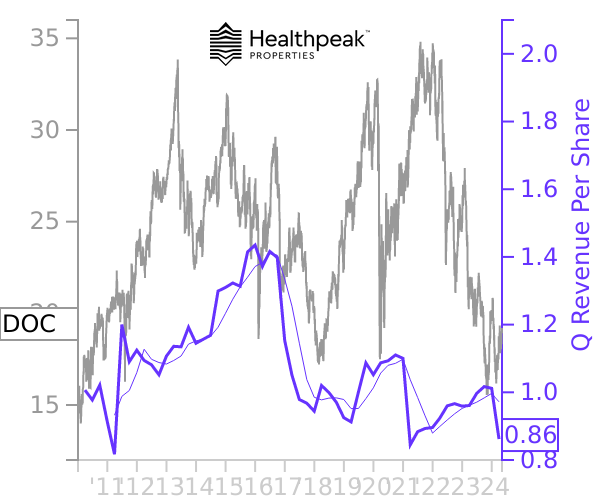
Health Care REITs
Healthpeak Properties
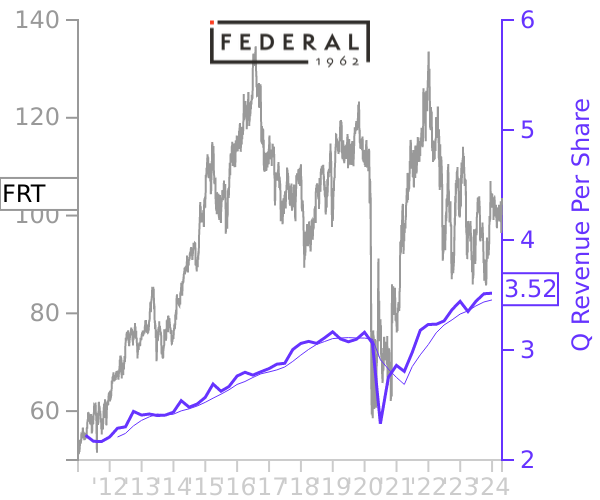
Shopping Center REITs
Federal Realty Investment Trust
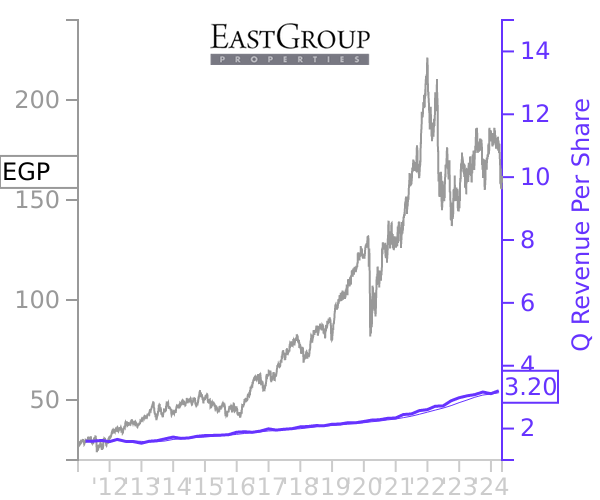
Industrial REITs
EastGroup Properties
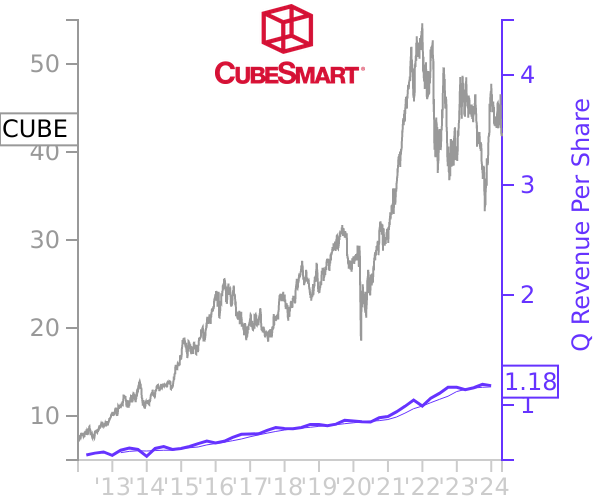
Self Storage REITs
CubeSmart
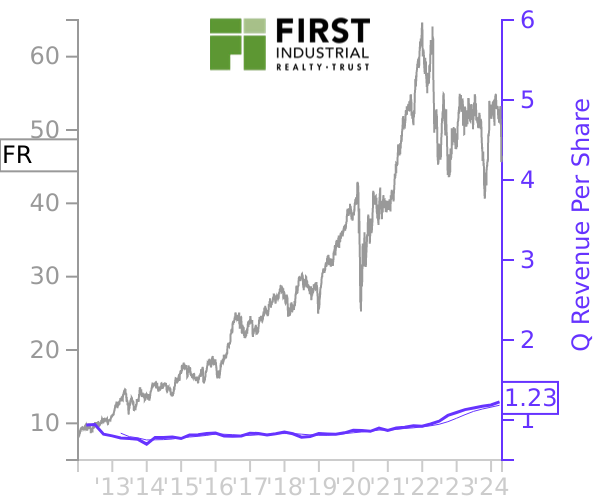
Industrial REITs
First Industrial Realty Trust
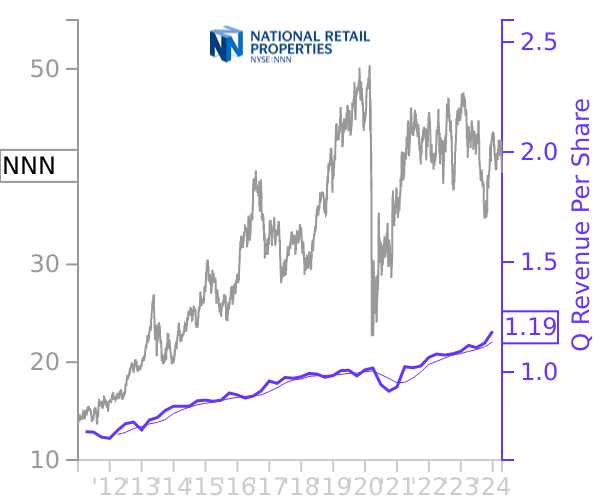
Net Lease REITs
National Retail Properties
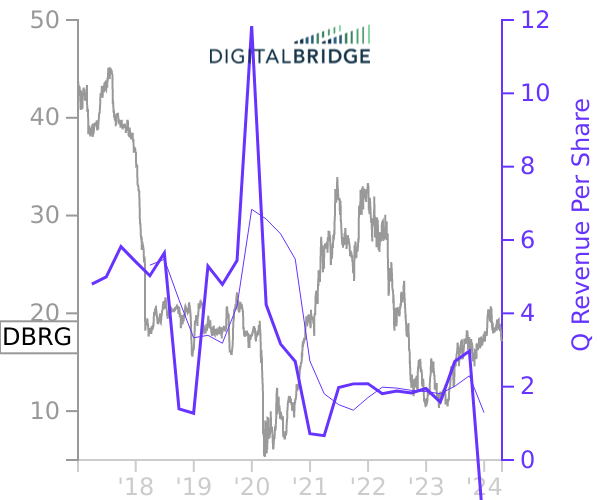
Infrastructure REITs
DigitalBridge
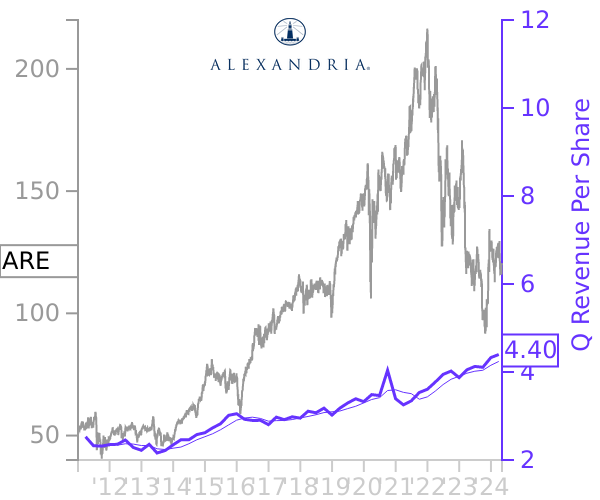
Office REITs
Alexandria Real Estate
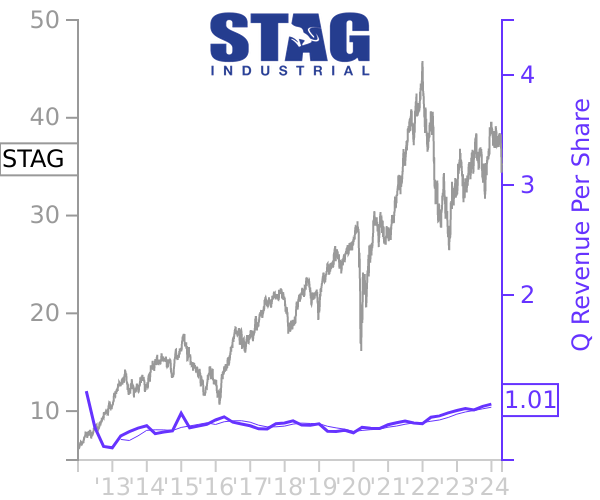
Industrial REITs
STAG Industrial
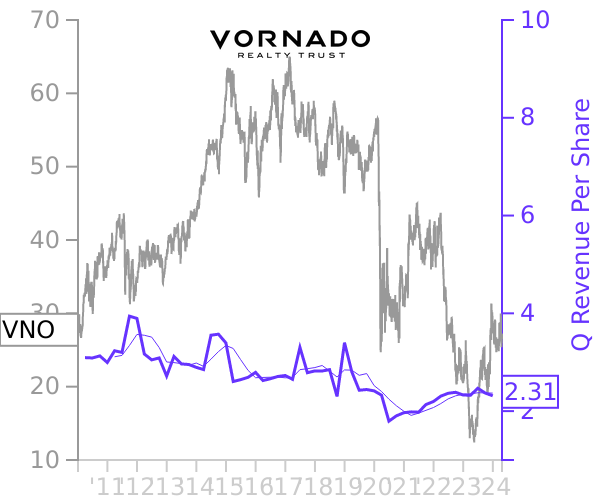
Diversified REITs
Vornado Realty Trust
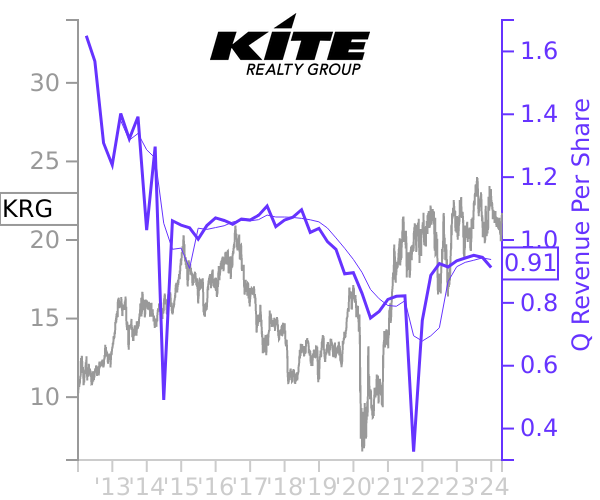
Shopping Center REITs
Kite Realty Trust
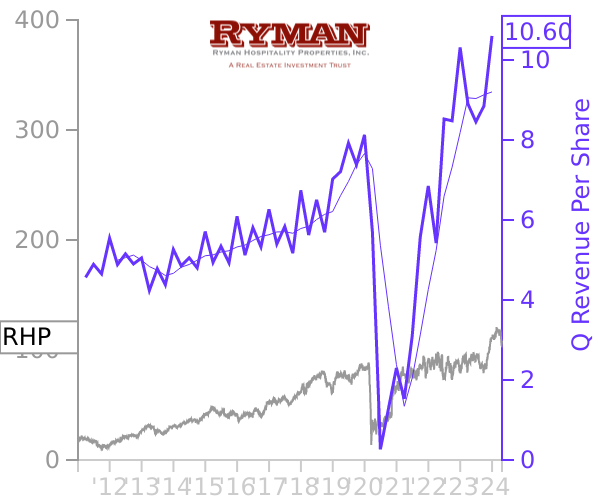
Hotel REITs
Ryman Hospitality Properties
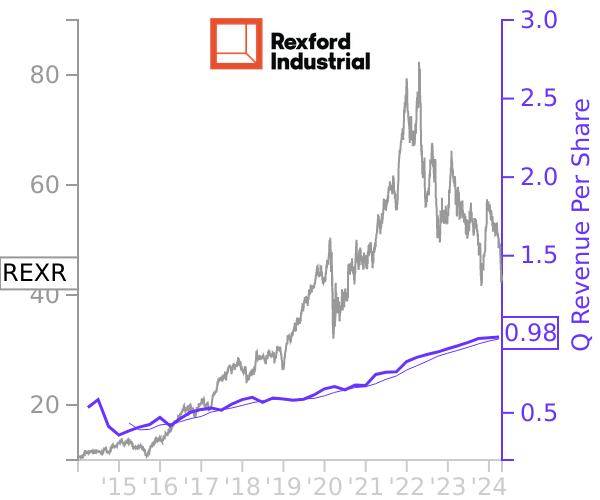
Industrial REITs
Rexford Industrial Realty
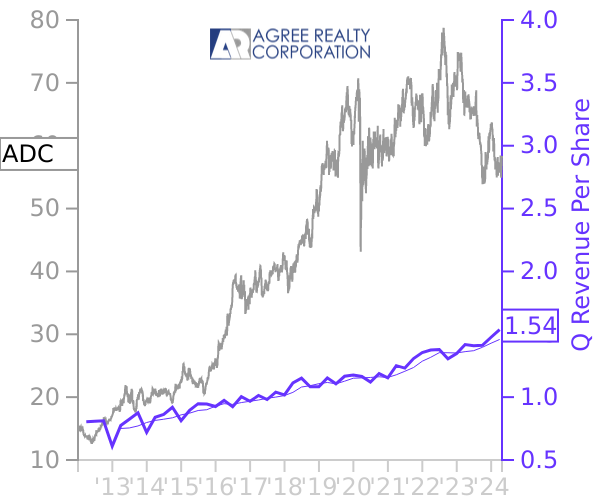
Net Lease REITs
Agree Realty
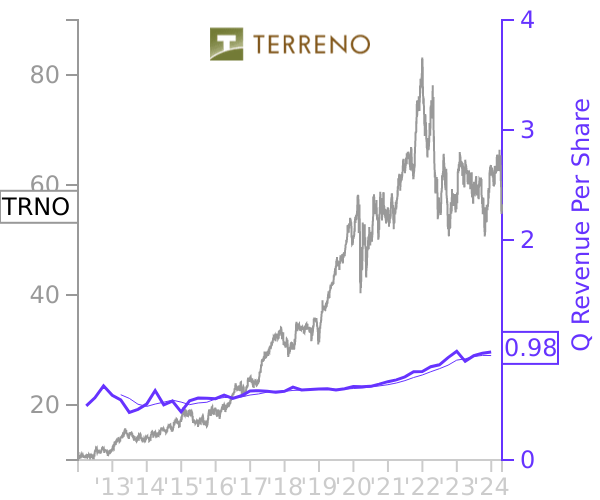
Industrial REITs
Terreno Realty
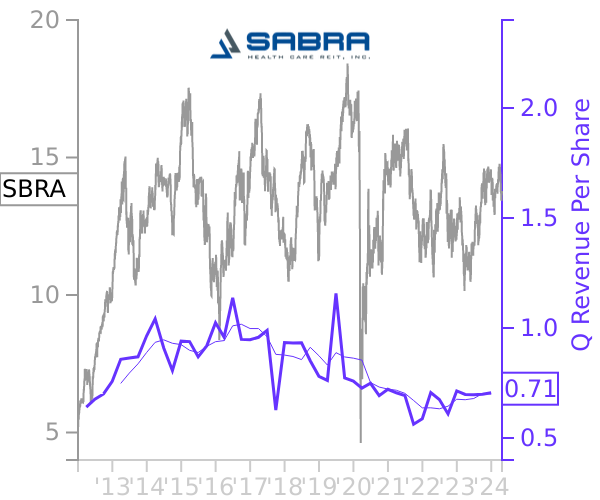
Health Care REITs
Sabra Health Care REIT
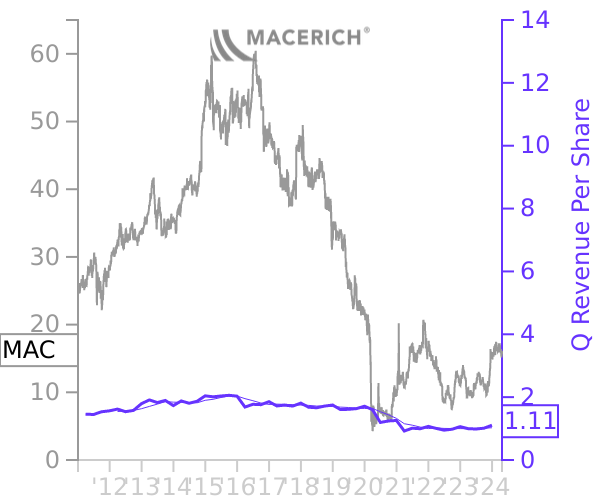
Regional Mall REITs
Macerich Co
Billboard REITs
Outfront Media
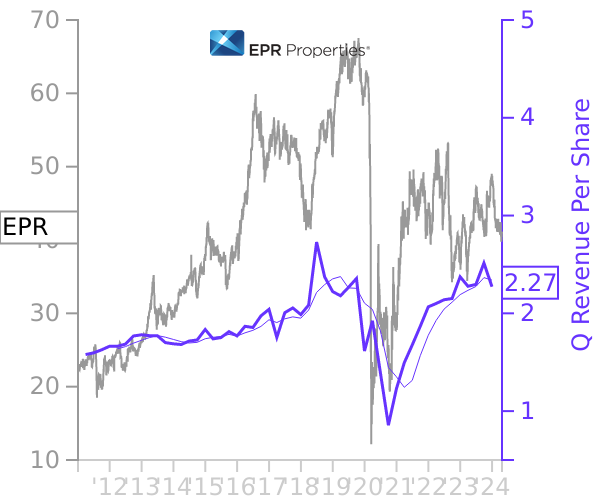
Net Lease REITs
EPR Properties
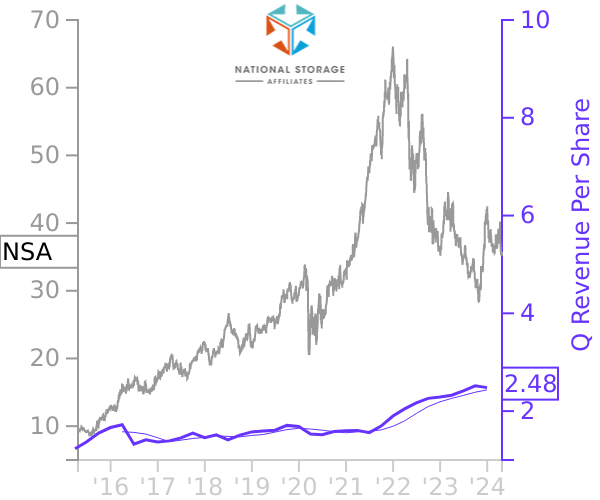
Self Storage REITs
National Storage Affiliates Trust
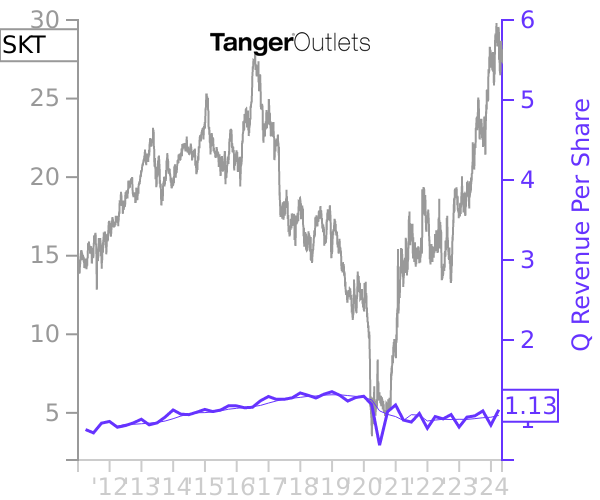
Regional Mall REITs
Tanger Factory Outlet Centers
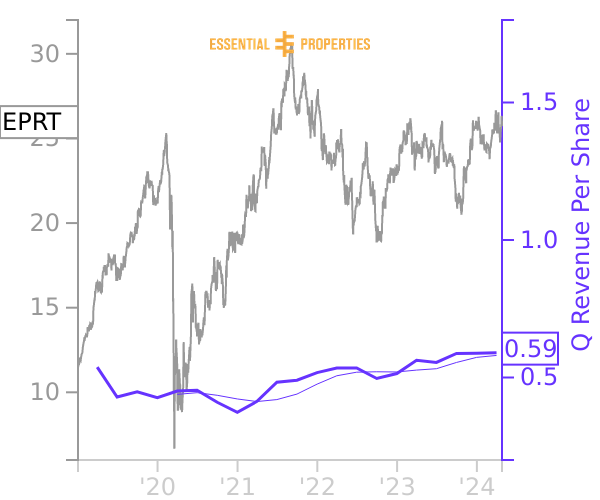
Net Lease REITs
Essential Properties Realty Trust
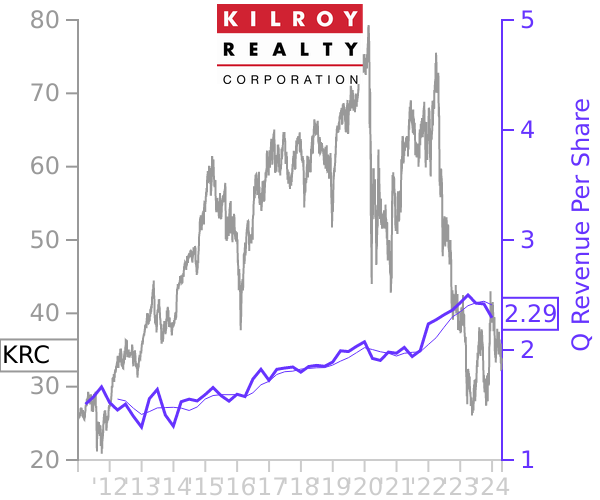
Office REITs
Kilroy Realty
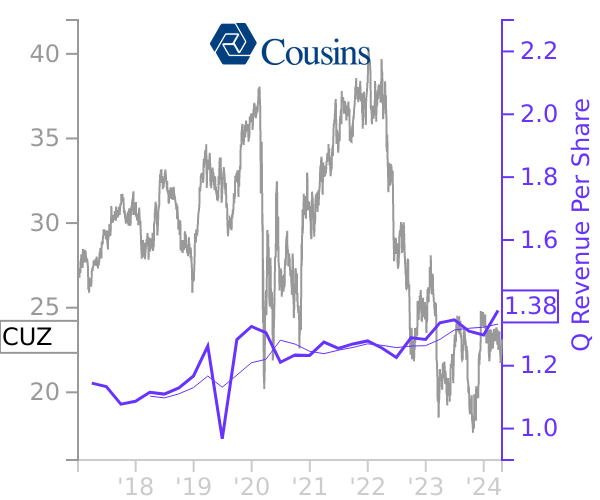
Office REITs
Cousins Properties
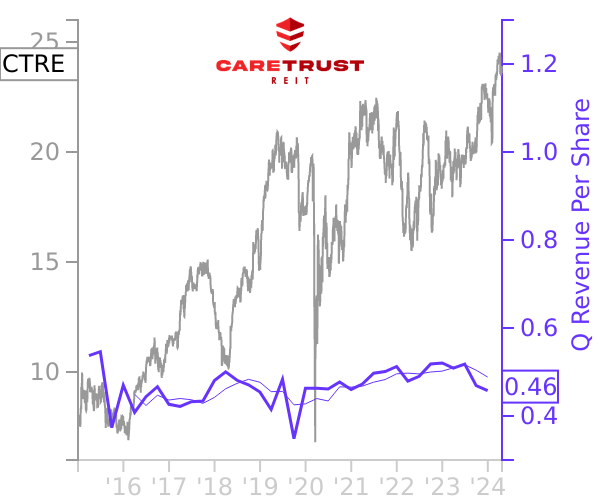
Health Care REITs
CareTrust REIT
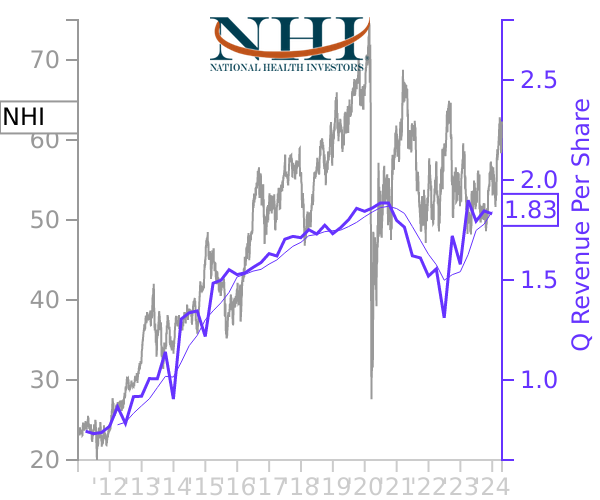
Health Care REITs
National Health Investors
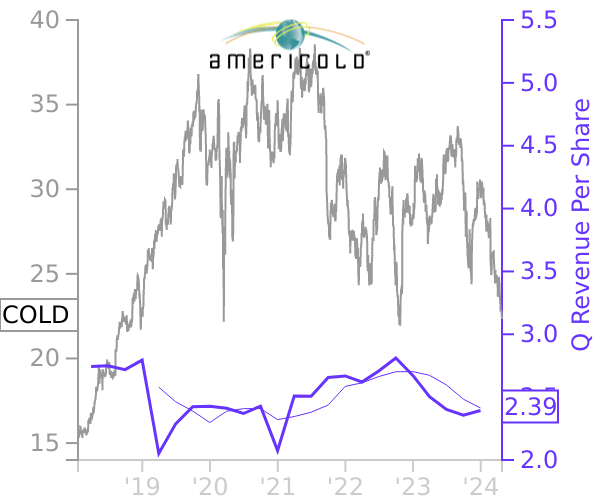
Industrial REITs
Americold Realty Trust
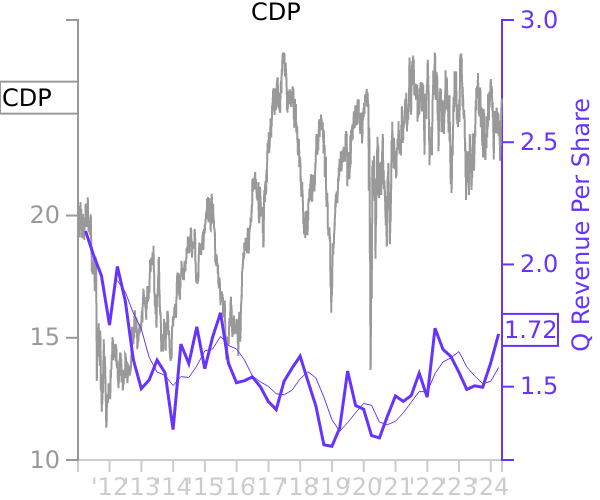
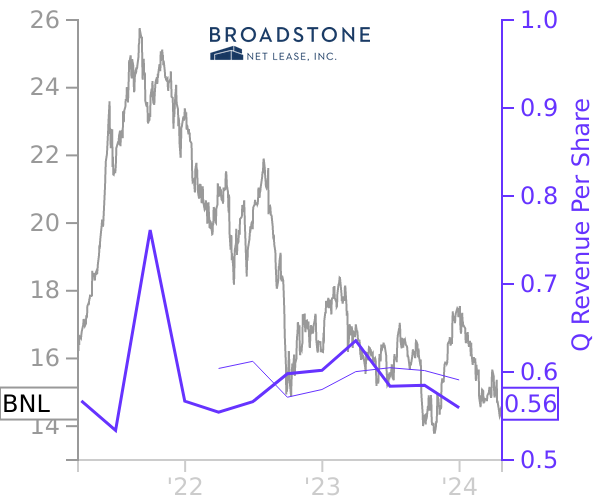
Diversified REITs
Broadstone Net Lease

Health Care REITs
Medical Properties Trust
Timberland REITs
Rayonier
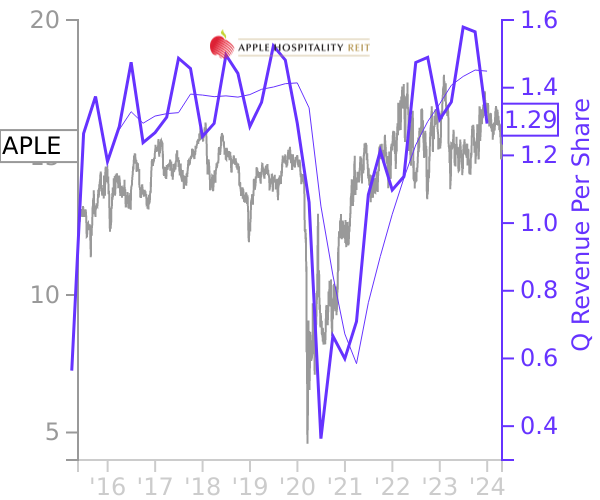
Hotel REITs
Apple Hospitality REIT
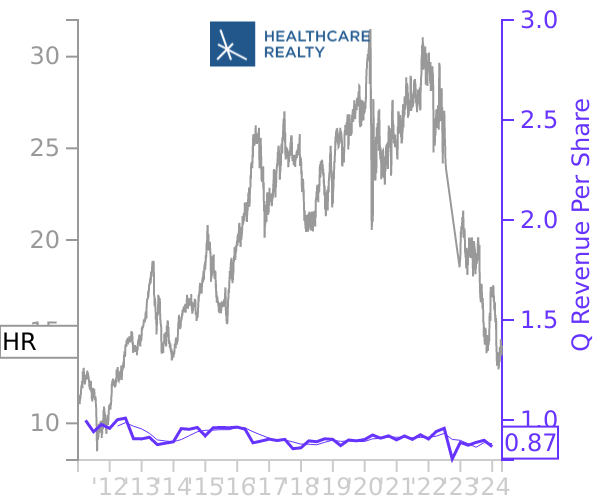
Health Care REITs
Healthcare Realty Trust
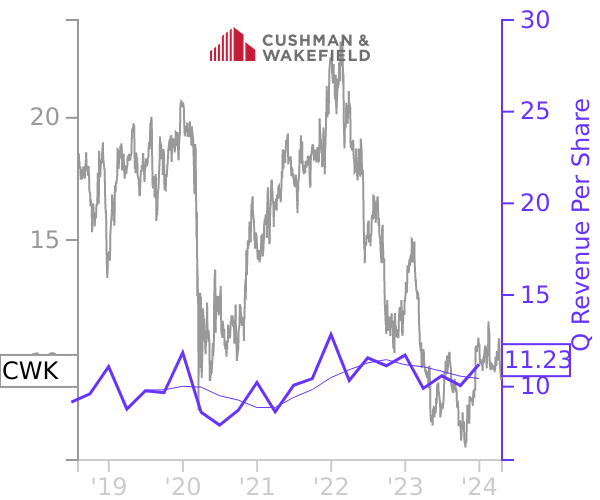
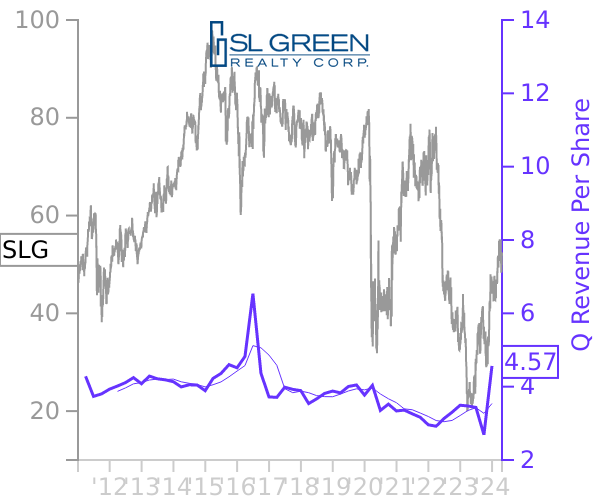
Office REITs
SL Green Realty
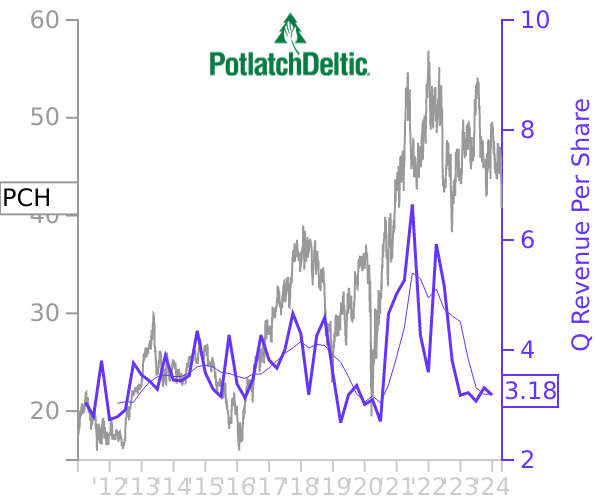
Timberland REITs
PotlatchDeltic
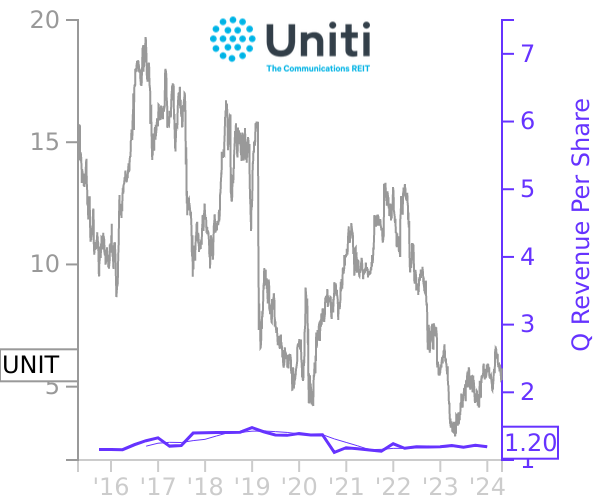
Infrastructure REITs
Uniti
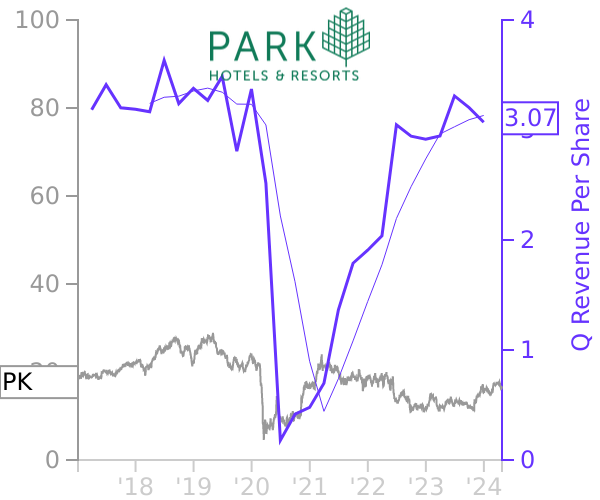
Hotel REITs
Park Hotels & Resorts
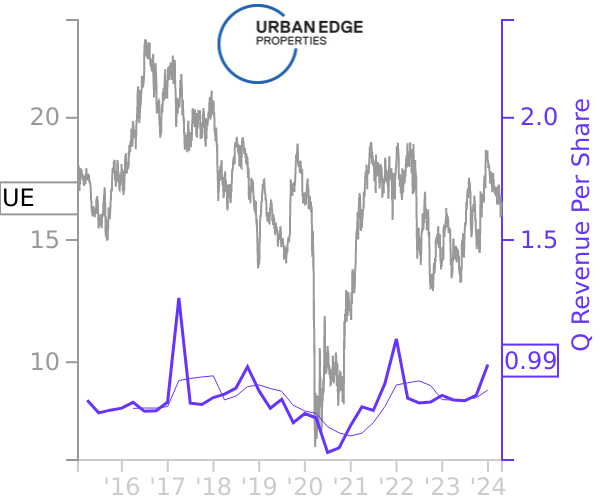
Shopping Center REITs
Urban Edge Properties
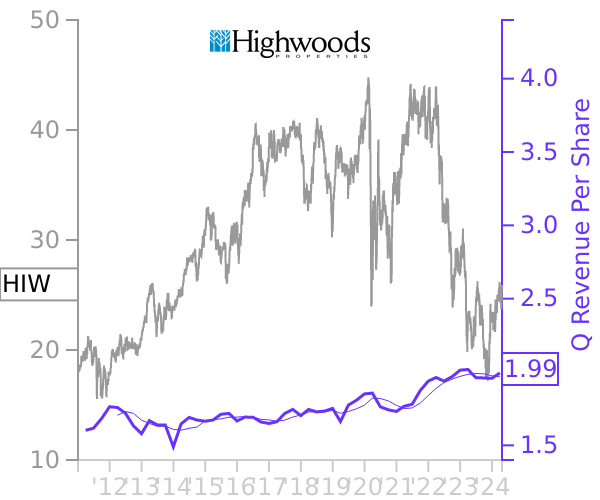
Office REITs
Highwoods Properties
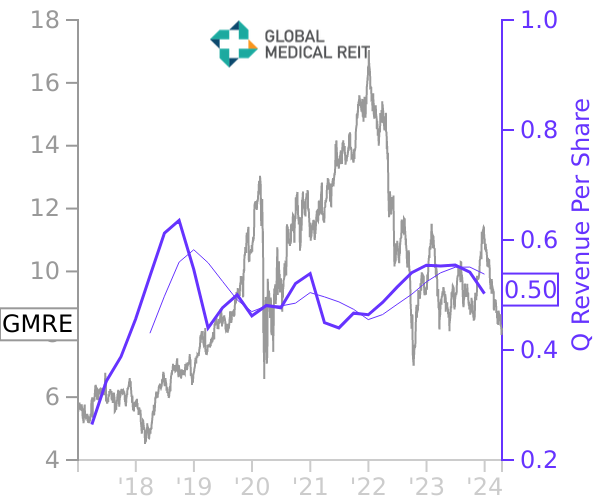
Health Care REITs
Global Medical REIT
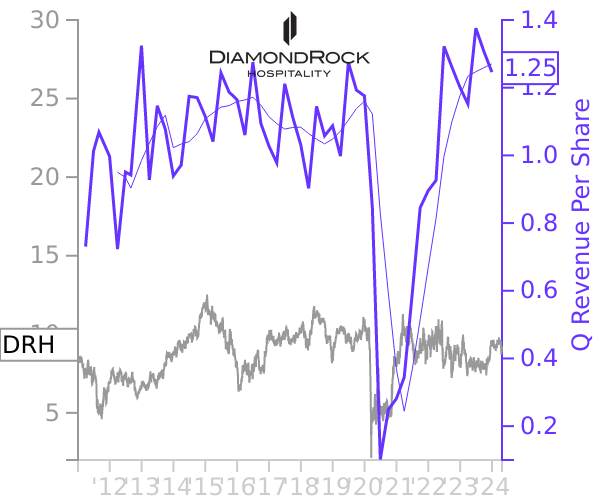
Hotel REITs
DiamondRock Hospitality Co
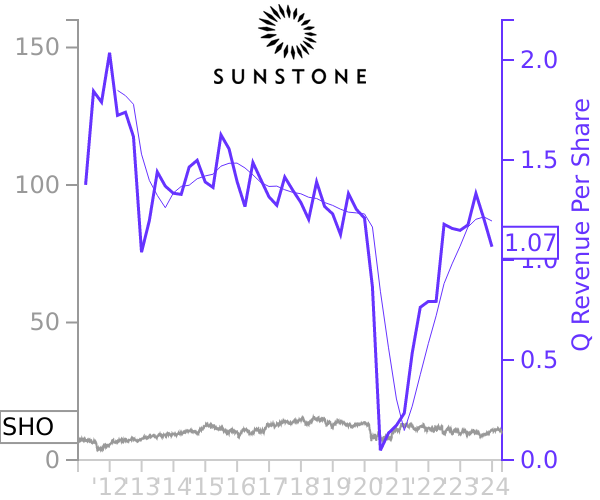
Hotel REITs
Sunstone Hotel Investors
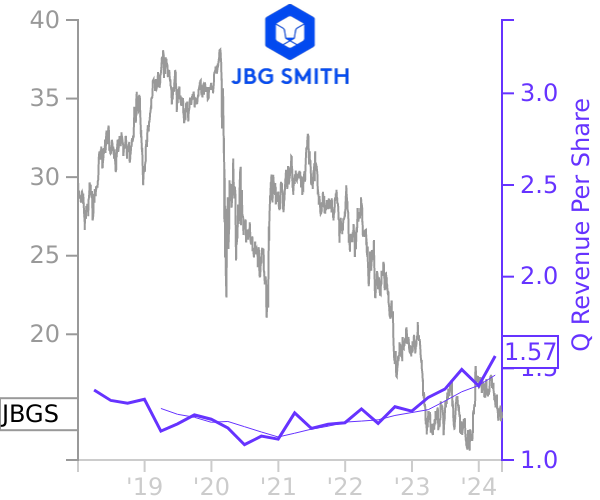
Diversified REITs
JBG SMITH Properties
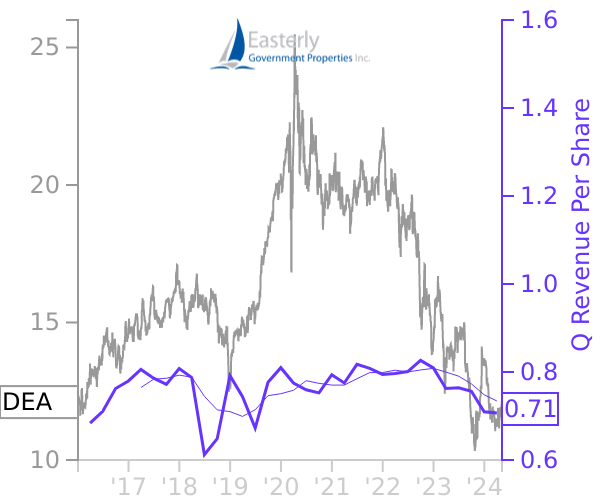
Office REITs
Easterly Government Properties
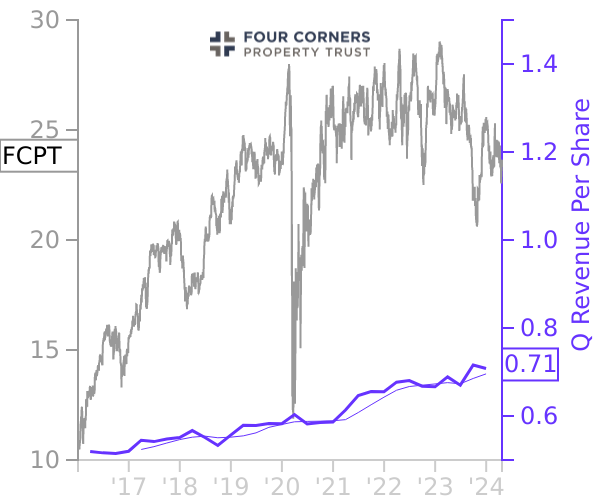
Net Lease REITs
Four Corners Property Trust
Office REITs
Douglas Emmett
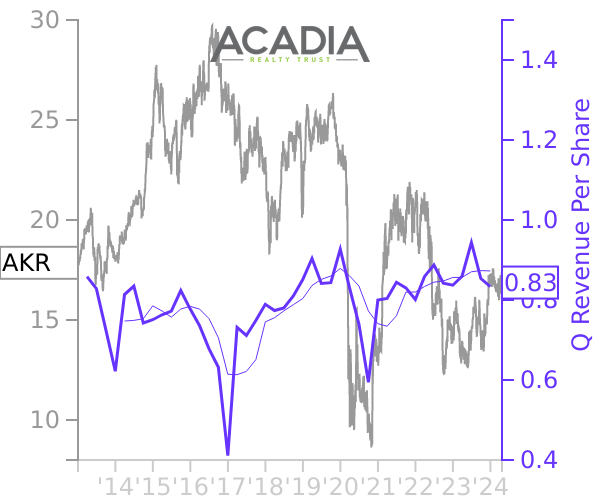
Shopping Center REITs
Acadia Realty Trust
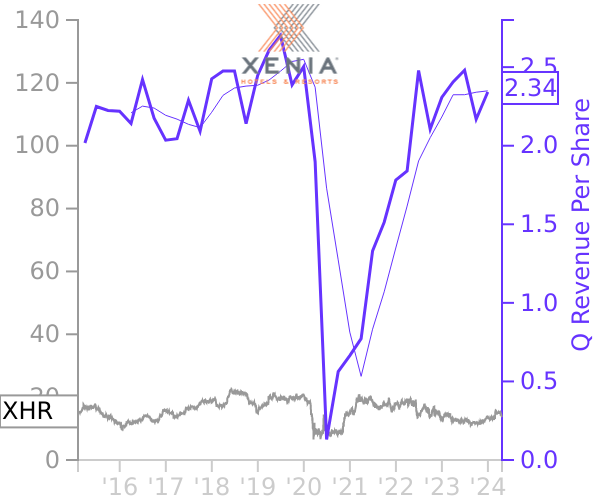
Hotel REITs
Xenia Hotels & Resorts
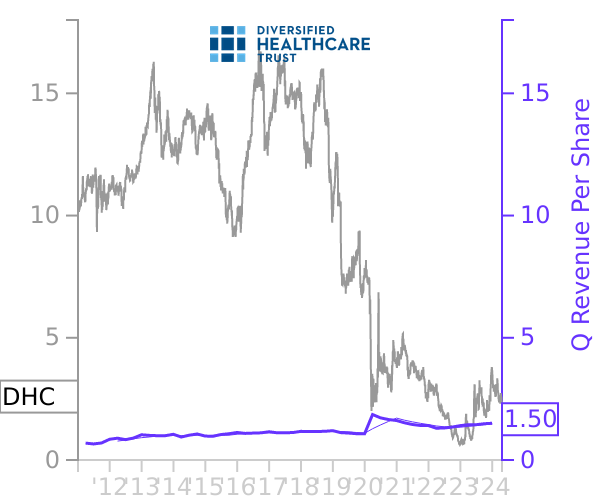
Health Care REITs
Diversified Healthcare Trust
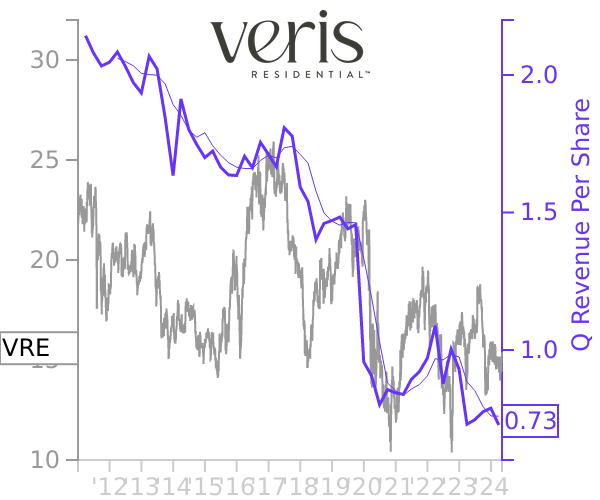
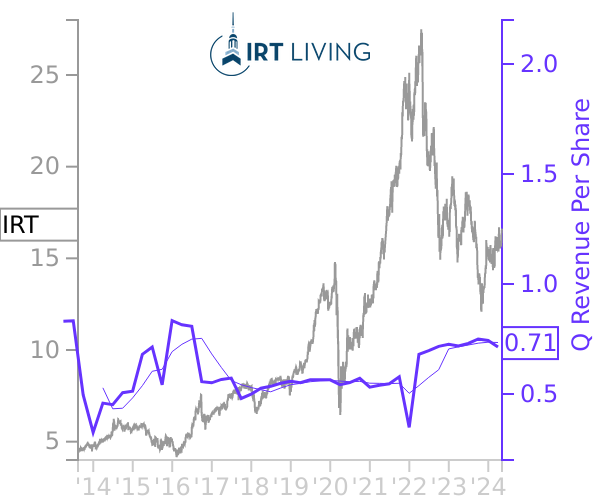
Apartment REITs
Independence Realty Trust
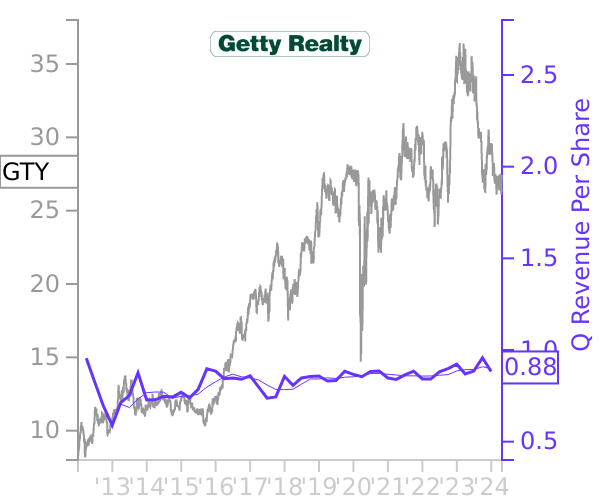
Net Lease REITs
Getty Realty
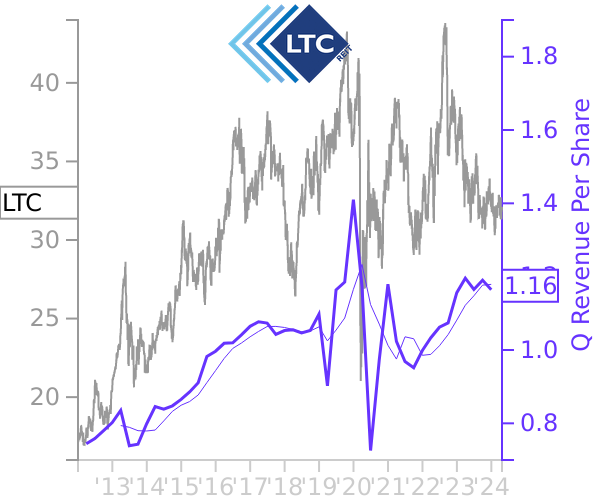
Health Care REITs
LTC Properties
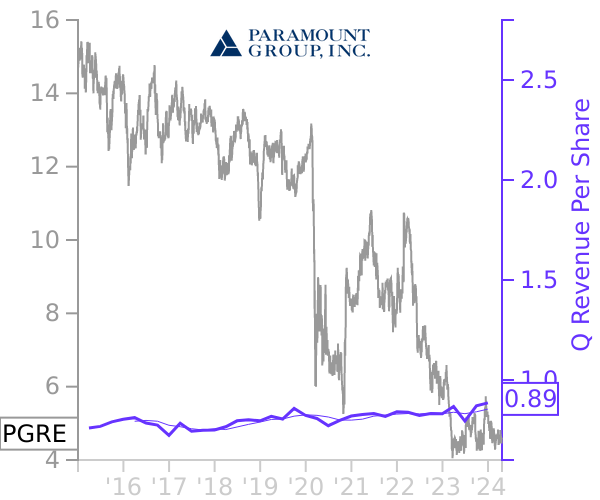
Office REITs
Paramount
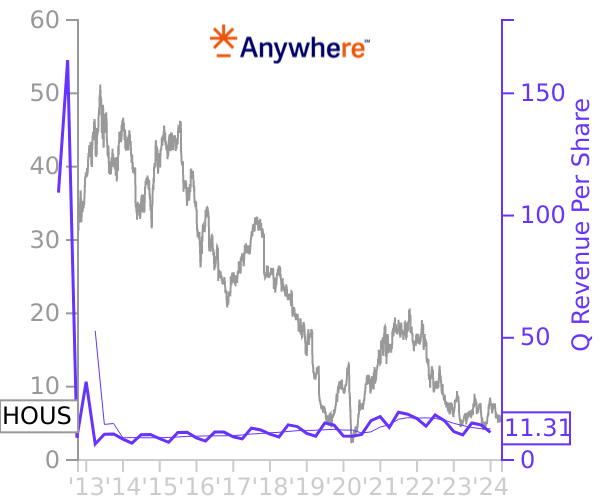
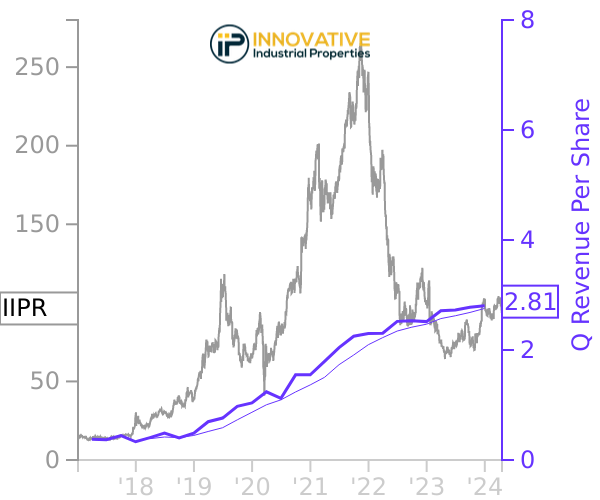
Cannabis REITs
Innovative Industrial Properties
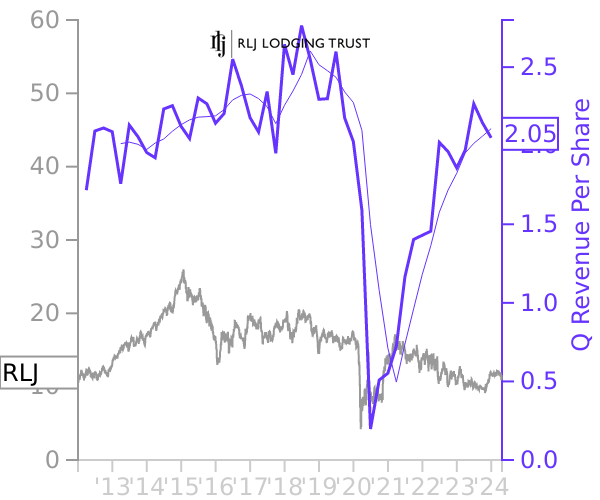
Hotel REITs
RLJ Lodging Trust
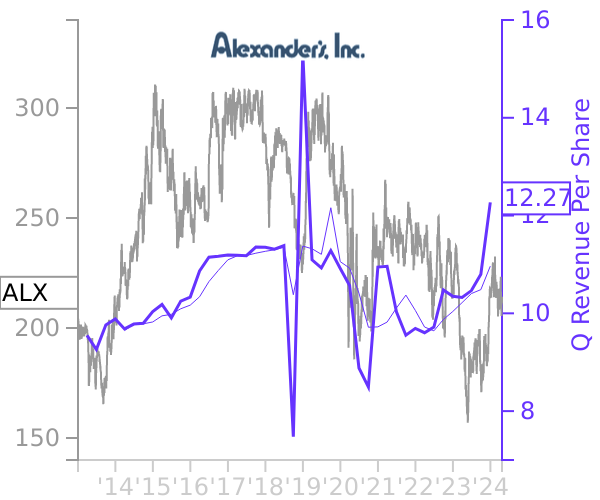
Diversified REITs
Alexander's
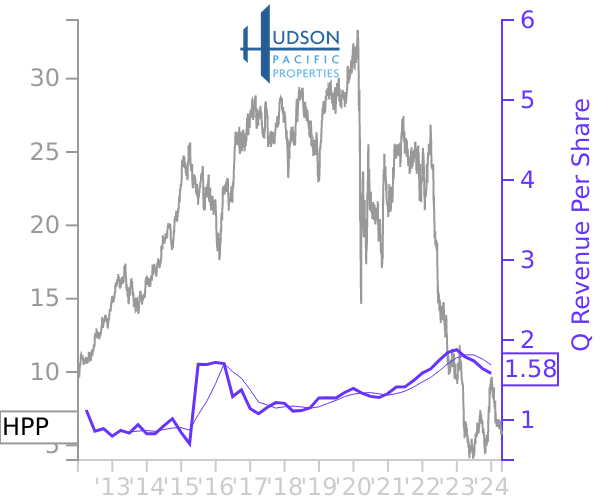
Office REITs
Hudson Pacific Properties
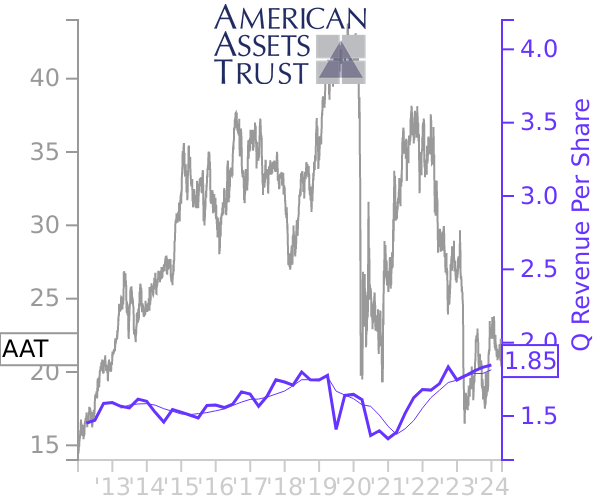
Diversified REITs
American Assets Trust
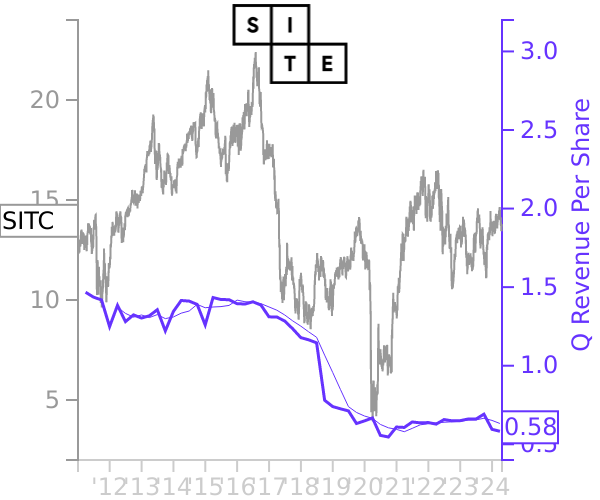
Shopping Center REITs
SITE Centers
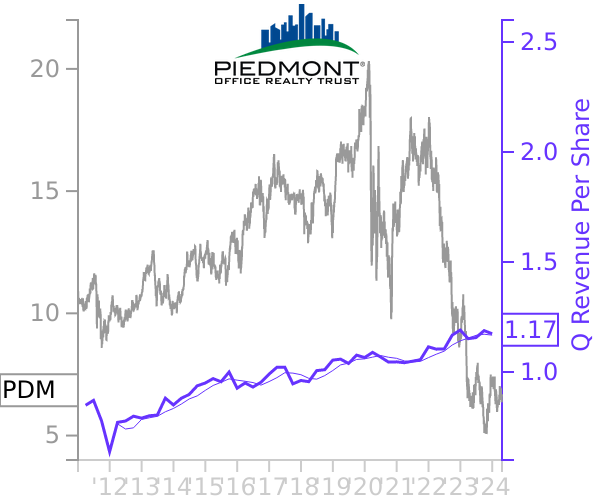
Office REITs
Piedmont Office Realty Trust
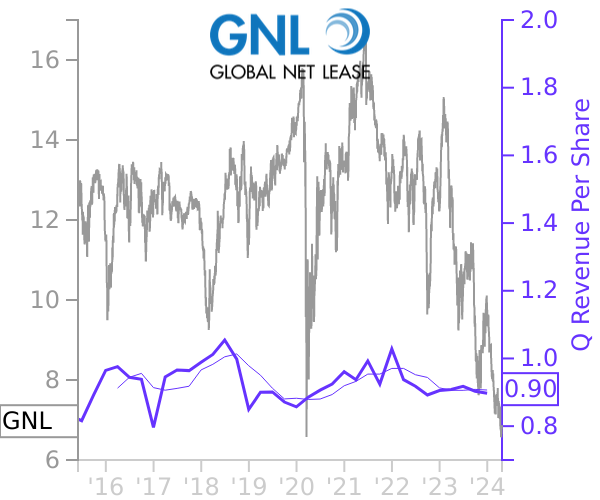
Diversified REITs
Global Net Lease
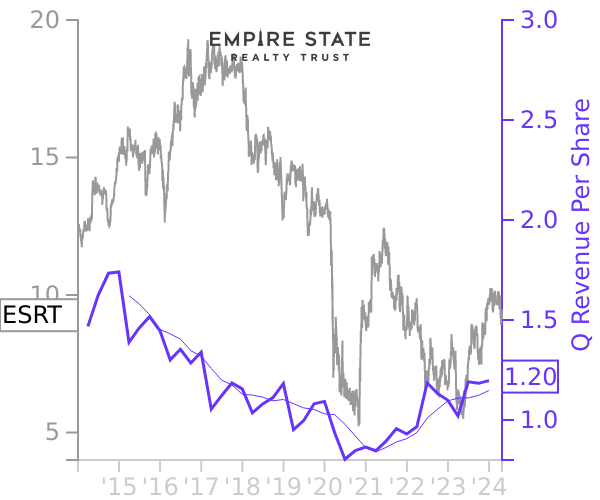
Office REITs
Empire State Realty Trust
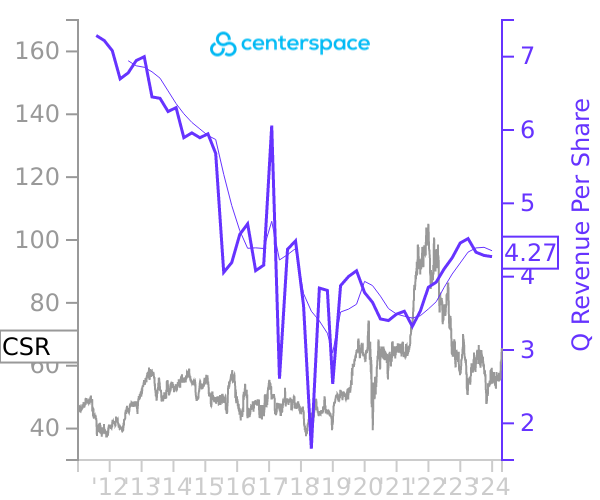
Apartment REITs
Centerspace
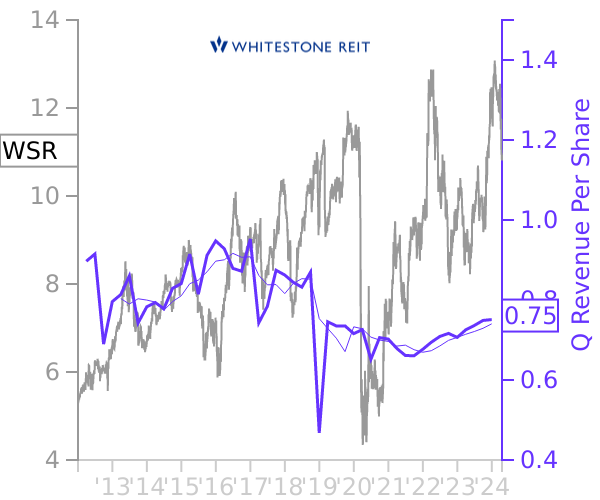
Shopping Center REITs
Whitestone REIT
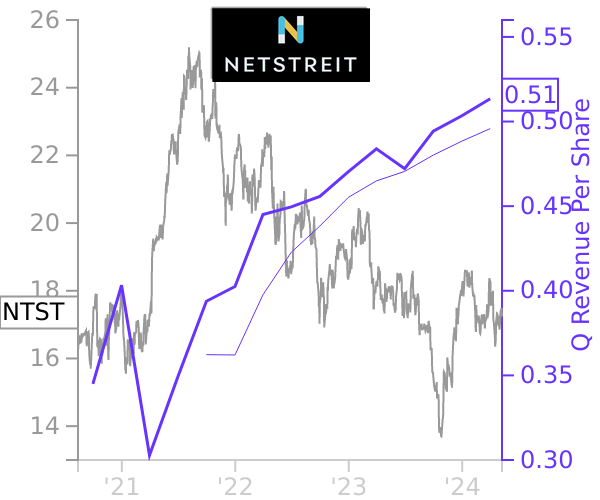
Net Lease REITs
NETSTREIT
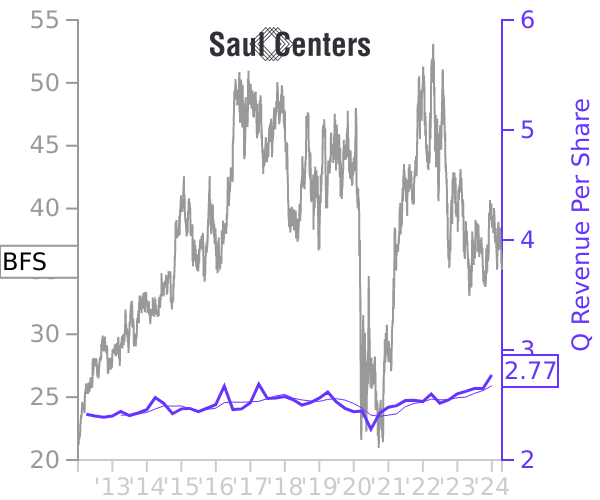
Shopping Center REITs
Saul Centers REIT
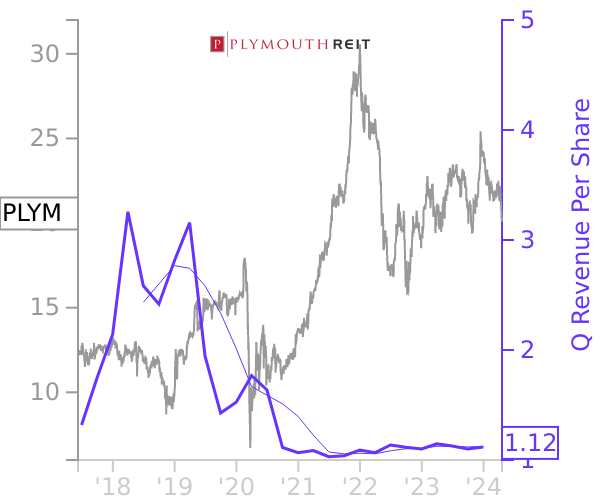
Industrial REITs
Plymouth Industrial REIT
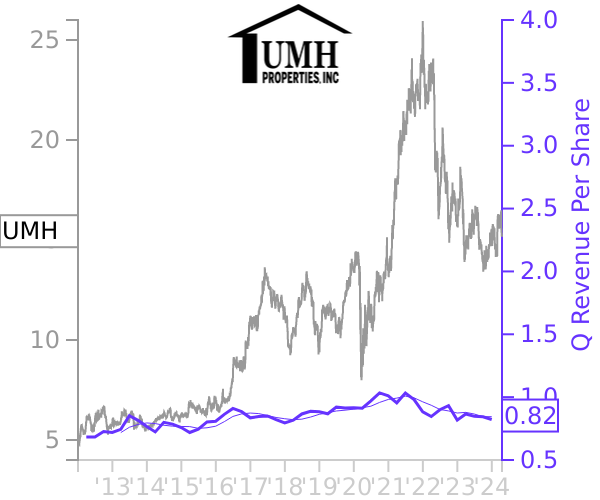
Manufactured Housing REITs
UMH Properties
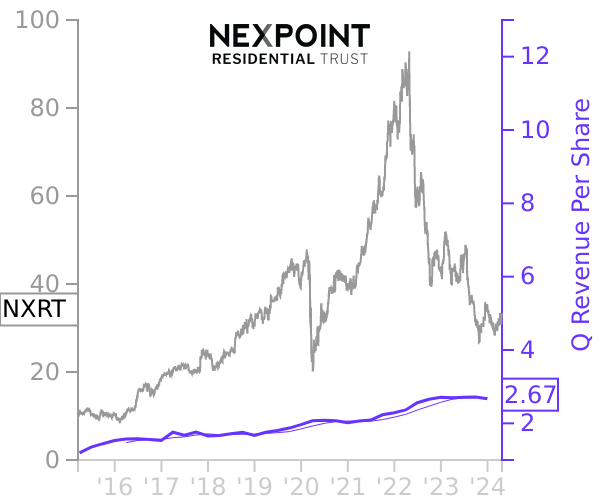
Apartment REITs
NexPoint Residential Trust
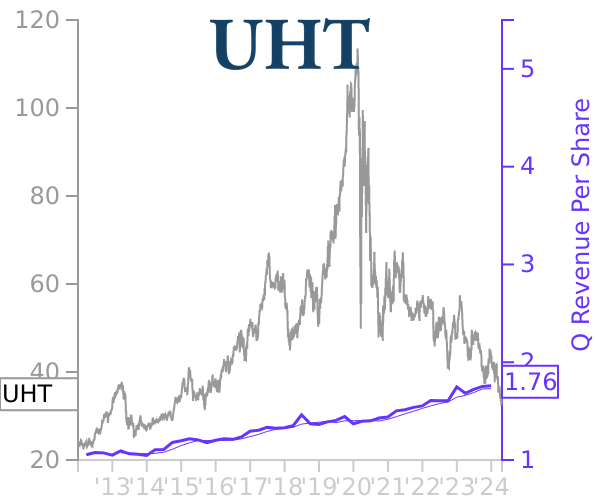
Health Care REITs
Universal Health Realty Income Trust
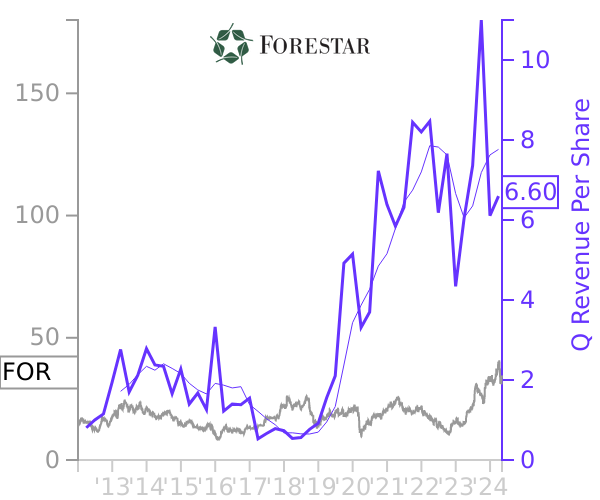
Farmland REITs
Farmland Partners
Hotel REITs
Summit Hotel Properties

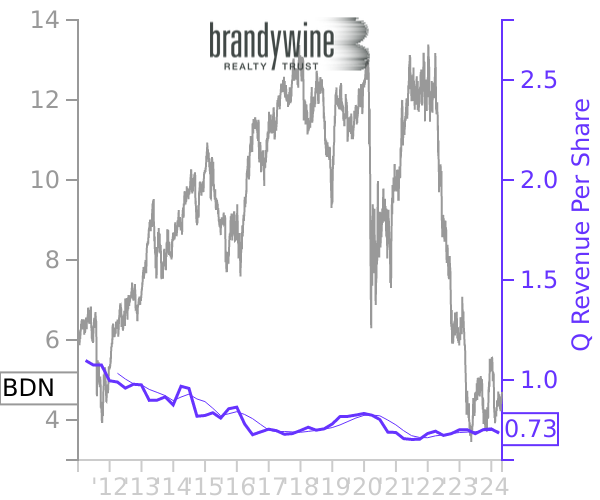
Office REITs
Brandywine Realty Trust
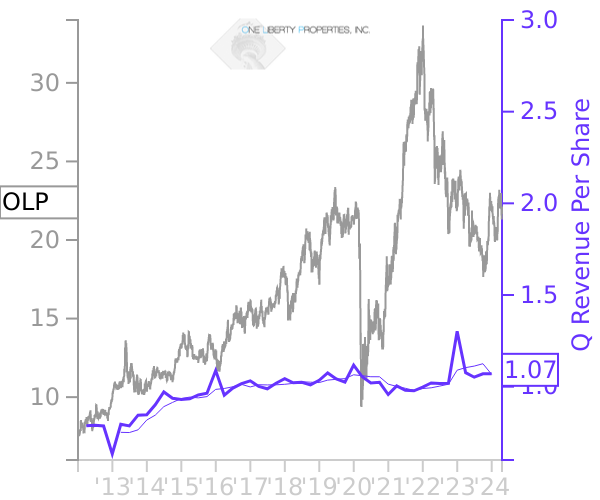
Diversified REITs
One Liberty Properties
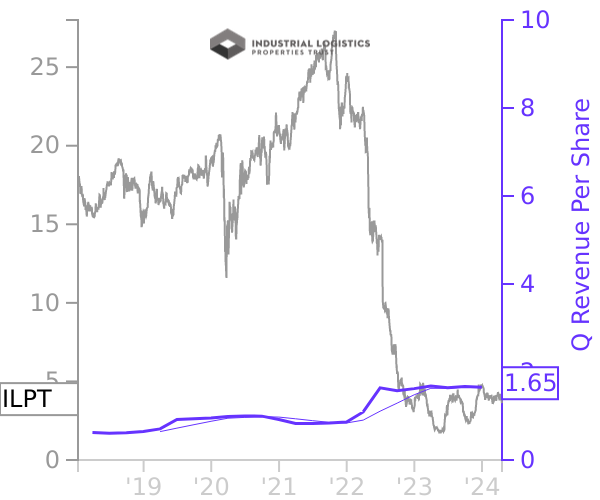
Industrial REITs
Industrial Logistics Properties Trust
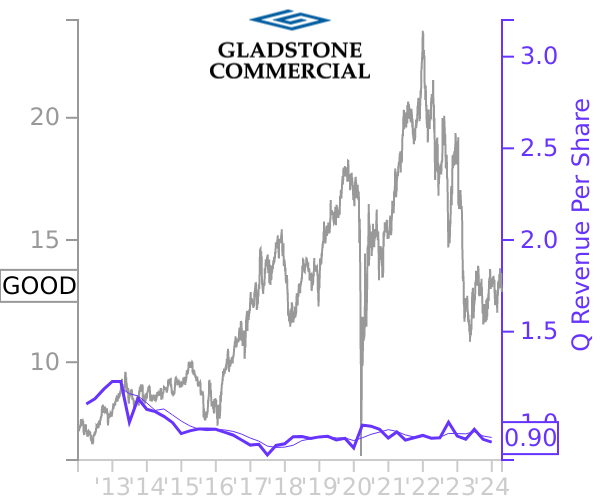
Diversified REITs
Gladstone Commercial
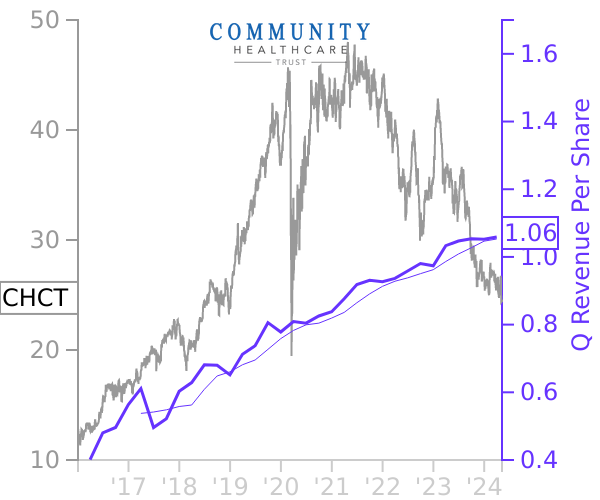
Health Care REITs
Community Healthcare Trust
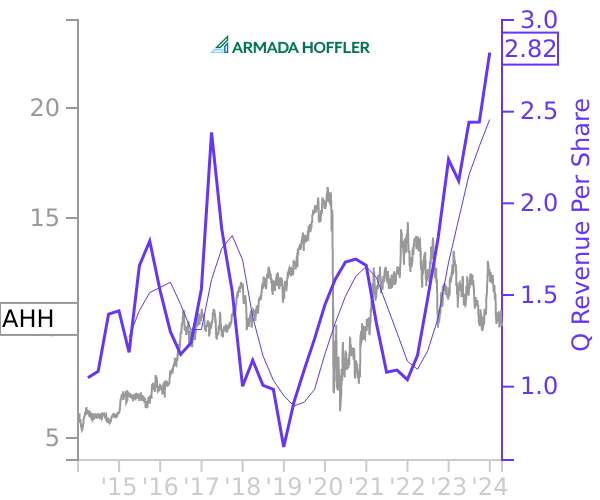
Diversified REITs
Armada Hoffler Properties
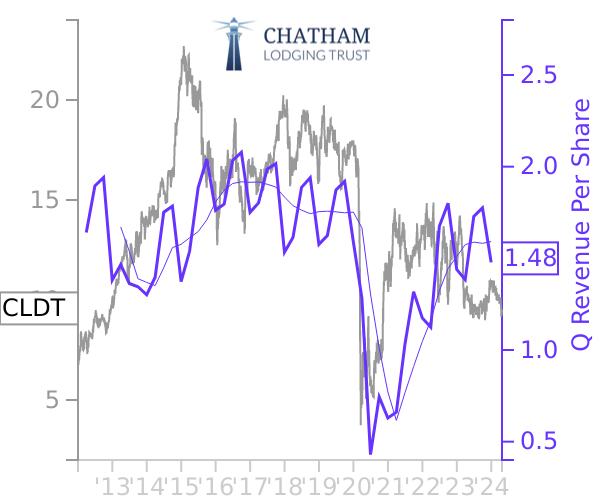
Hotel REITs
Chatham Lodging Trust
Farmland REITs
Gladstone Land
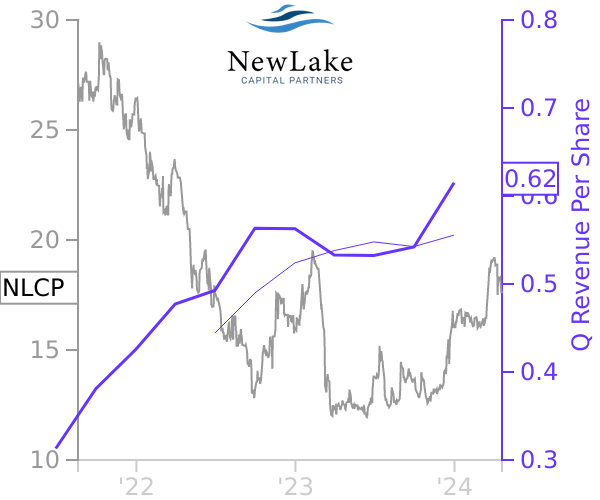
Cannabis REITs
NewLake Capital Partners
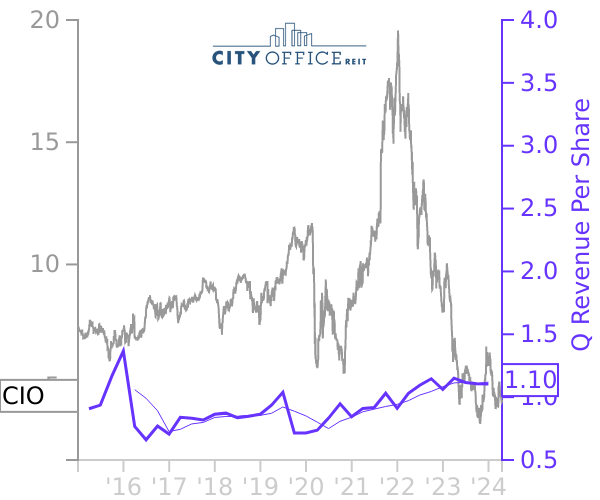
Office REITs
City Office REIT
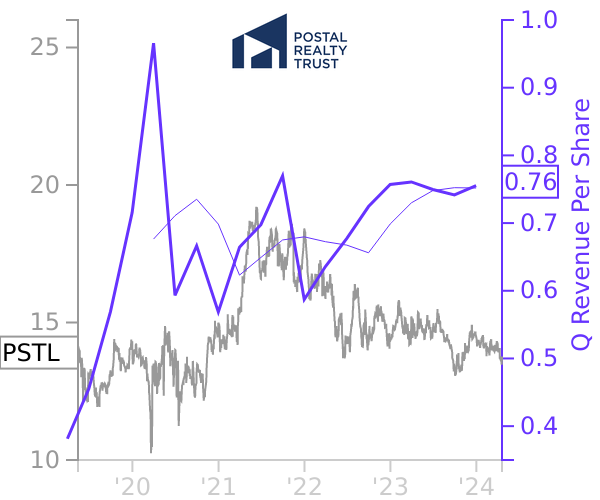
Net Lease REITs
Postal Realty Trust
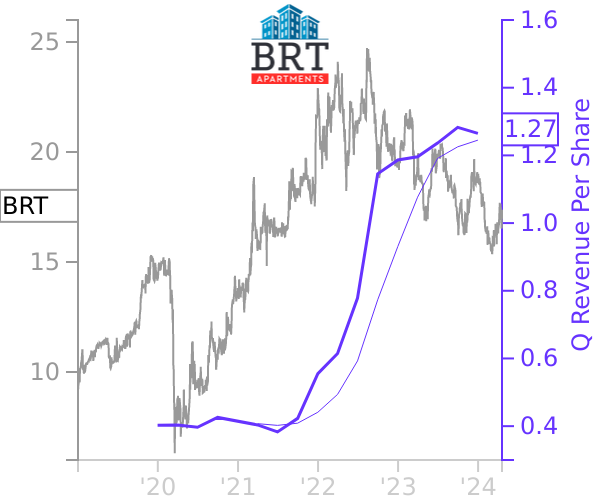
Apartment REITs
BRT Apartments
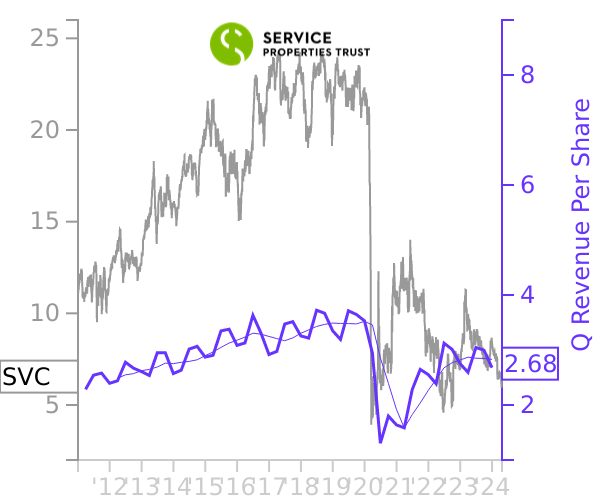
Diversified REITs
Service Properties Trust
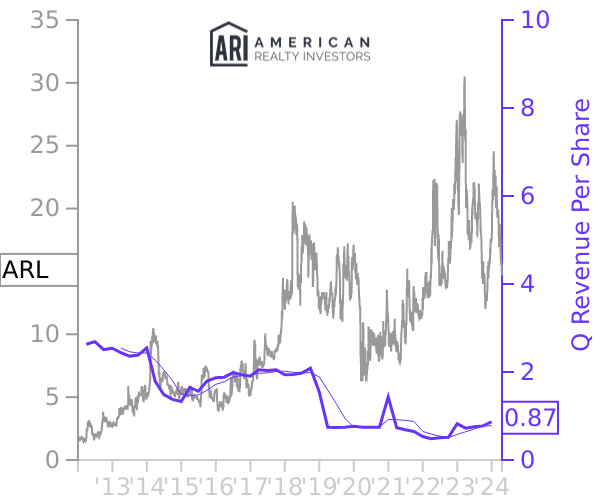
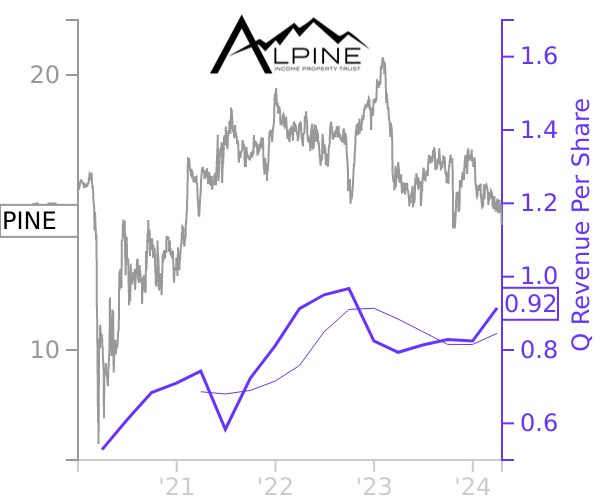
Net Lease REITs
Alpine Income Property Trust
Office REITs
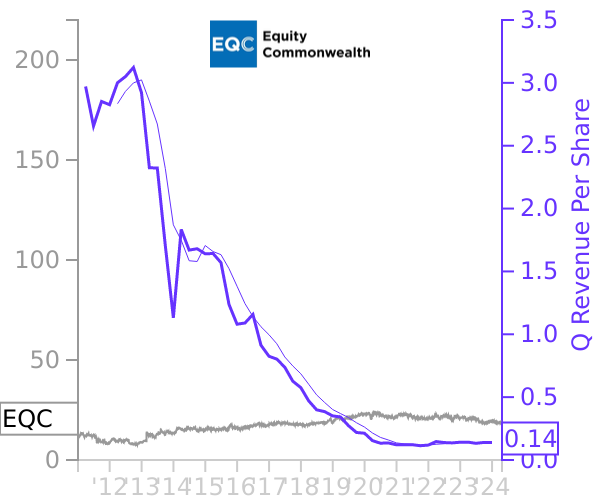
Equity Commonwealth
Hotel REITs
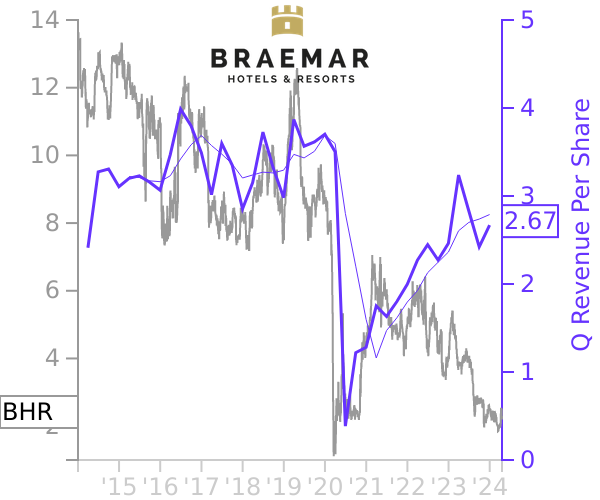
Braemar Hotels Resorts

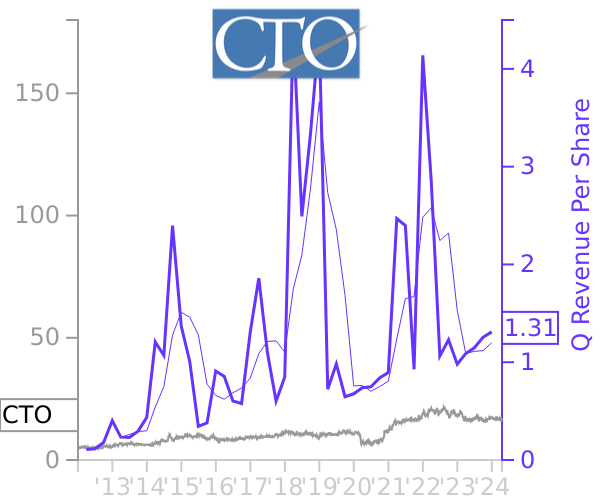
Shopping Center REITs
CTO Realty Growth
Net Lease REITs
Seritage Growth Properties
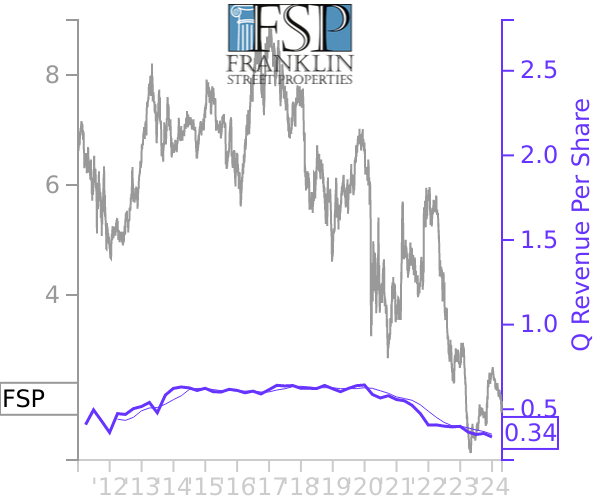
Office REITs
Franklin Street Properties REIT
Self Storage REITs
Global Self Storage
Apartment REITs
Clipper Realty
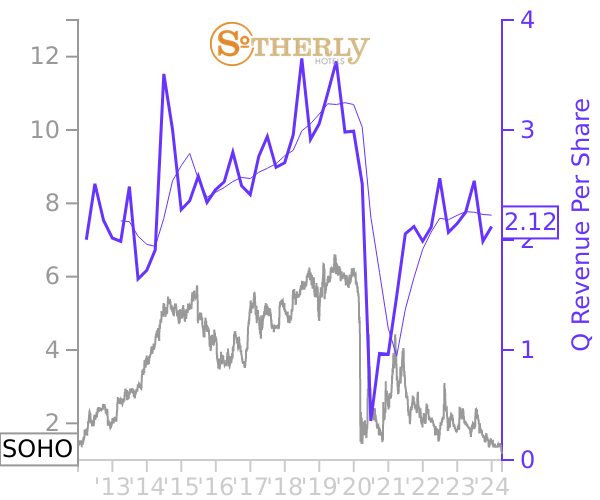
Hotel REITs
Sotherly Hotels REIT