Industrials › Glass Products, Made Of Purchased Glass

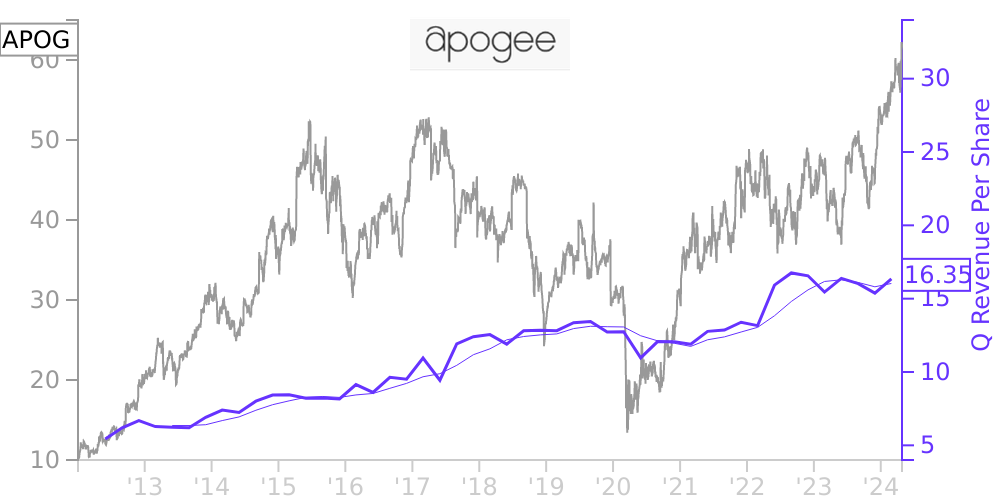
APOG Stock Price Correlated With Apogee Enterprises Financials
External Links ⌄
Income Statement
Cash Flow
Balance Sheet
APOG Income Statement
Enable JavaScript and reload
Revenue, Net:
Cost of Goods & Services Sold:
Gross Profit:
Selling, General & Admin Expense:
Research & Development Expense:
Total Operating Expenses:
Operating Income:
Income Taxes:
Net Income:
APOG Cash Flow
Enable JavaScript and reload
Operating Activities Net Income:
Depreciation, Depletion & Amortization:
Change in Accounts Receiveable:
Net Cash from Operations:
Repurchases/Buybacks Common Stock:
Issuance of Long-term Debt:
Cash Dividends Paid:
Net Cash from Financing Activities:
Property, Plant & Equipment Purchases:
Purchases of Businesses, Net of Cash:
Net Cash from Investing Activities:
Net Change in Cash & Equivalents:
APOG Balance Sheet
Enable JavaScript and reload
Cash and Cash Equivalents:
Short-Term Investments:
Accounts Receivable, Net:
Inventories:
Total Current Assets:
Property, Plant & Equipment, Net:
Total Assets:
Accounts Payable:
Current Portion of Long-Term Debt:
Total Short-Term Liabilities:
Long Term Debt, Non-Current Portion:
Total Long-Term Liabilities:
Total Liabilities:
COMPANY PROFILE
Summary of Significant Accounting Policies Basis of presentation
The consolidated financial statements of Apogee Enterprises, Inc. (we, us, our or the Company) have been prepared in accordance with accounting principles generally accepted in the United States. The information included in this Form 10-Q should be read in conjunction with the Company’s Form 10-K for the year ended February 26, 2022. We use the same accounting policies in preparing quarterly and annual financial statements. All adjustments necessary for a fair presentation of quarterly and year to date operating results are reflected herein and are of a normal, recurring nature. The results of operations for the three-month period ended May 28, 2022 are not necessarily indicative of the results to be expected for the full year.
At the beginning of the first quarter of fiscal 2023, we began management of the Sotawall and Harmon businesses under the Architectural Services segment in order to create a single, unified offering for larger custom curtainwall projects. The comparative fiscal 2022 segment results for the Architectural Framing Systems and Architectural Services segments have been recast to reflect the move of the Sotawall business into the Architectural Services segment from the Architectural Framing Systems segment, effective at the start of the first quarter of fiscal 2023.
Free historical financial statements for Apogee Enterprises Inc. See how revenue, income, cash flow, and balance sheet financials have changed over 57 quarters since 2012. Compare with APOG stock chart to see long term trends.
Data imported from Apogee Enterprises Inc SEC filings. Check original filings before making any investment decision.