Consumer Discretionary › Motor Vehicle Parts And Accessories

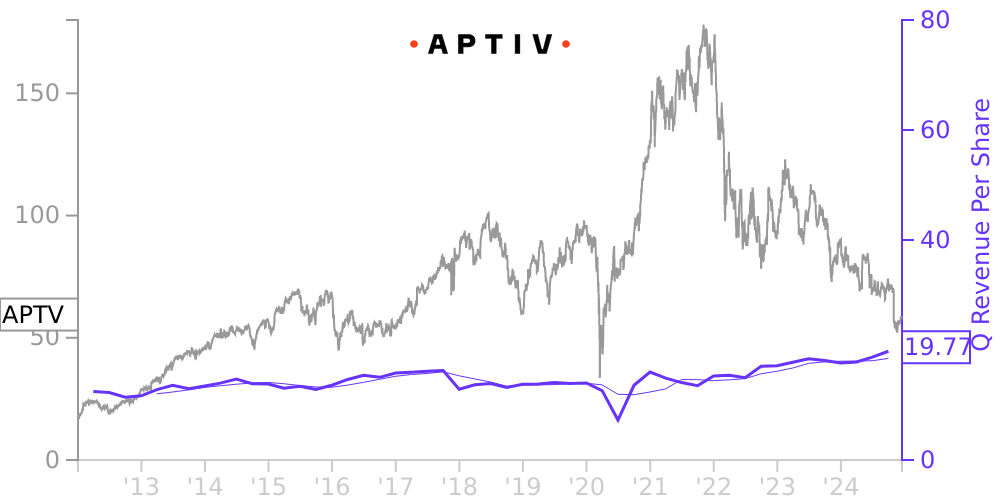
APTV Stock Price Correlated With Aptiv Financials
External Links ⌄
Income Statement
Cash Flow
Balance Sheet
APTV Income Statement
Enable JavaScript and reload
Revenue, Net:
Cost of Goods & Services Sold:
Gross Profit:
Selling, General & Admin Expense:
Research & Development Expense:
Total Operating Expenses:
Operating Income:
Income Taxes:
Net Income:
APTV Cash Flow
Enable JavaScript and reload
Operating Activities Net Income:
Depreciation, Depletion & Amortization:
Change in Accounts Receiveable:
Net Cash from Operations:
Repurchases/Buybacks Common Stock:
Issuance of Long-term Debt:
Cash Dividends Paid:
Net Cash from Financing Activities:
Property, Plant & Equipment Purchases:
Purchases of Businesses, Net of Cash:
Net Cash from Investing Activities:
Net Change in Cash & Equivalents:
APTV Balance Sheet
Enable JavaScript and reload
Cash and Cash Equivalents:
Short-Term Investments:
Accounts Receivable, Net:
Inventories:
Total Current Assets:
Property, Plant & Equipment, Net:
Total Assets:
Accounts Payable:
Current Portion of Long-Term Debt:
Total Short-Term Liabilities:
Long Term Debt, Non-Current Portion:
Total Long-Term Liabilities:
Total Liabilities:
COMPANY PROFILE
GENERAL General and basis of presentation —“Aptiv,” the “Company,” “we,” “us” and “our” refer to Aptiv PLC (formerly known as Delphi Automotive PLC), a public limited company formed under the laws of Jersey on May 19, 2011, which completed an initial public offering on November 22, 2011, and its consolidated subsidiaries. On December 4, 2017, following the spin-off of Delphi Technologies, the Company changed its name to Aptiv PLC and its NYSE symbol to “APTV.”
The consolidated financial statements have been prepared in accordance with accounting principles generally accepted in the United States of America (“U.S. GAAP”).
Nature of operations —Aptiv is a leading global technology and mobility architecture company primarily serving the automotive sector. We deliver end-to-end mobility solutions enabling our customers' transition to more electrified, software-defined vehicles. We design and manufacture vehicle components and provide electrical, electronic and active safety technology solutions to the global automotive and commercial vehicle markets. Aptiv is one of the largest vehicle technology suppliers and our customers include the 25 largest automotive original equipment manufacturers (“OEMs”) in the world. Aptiv operates 127 major manufacturing facilities and 12 major technical centers utilizing a regional service model that enables the Company to efficiently and effectively serve its global customers from best cost countries. Aptiv has a presence in 46 countries and has approximately 18,900 scientists, engineers and technicians focused on developing market relevant product solutions for its customers.
Free historical financial statements for Aptiv plc. See how revenue, income, cash flow, and balance sheet financials have changed over 57 quarters since 2012. Compare with APTV stock chart to see long term trends.
Data imported from Aptiv plc SEC filings. Check original filings before making any investment decision.