Materials › Bituminous Coal And Lignite Surface Mining

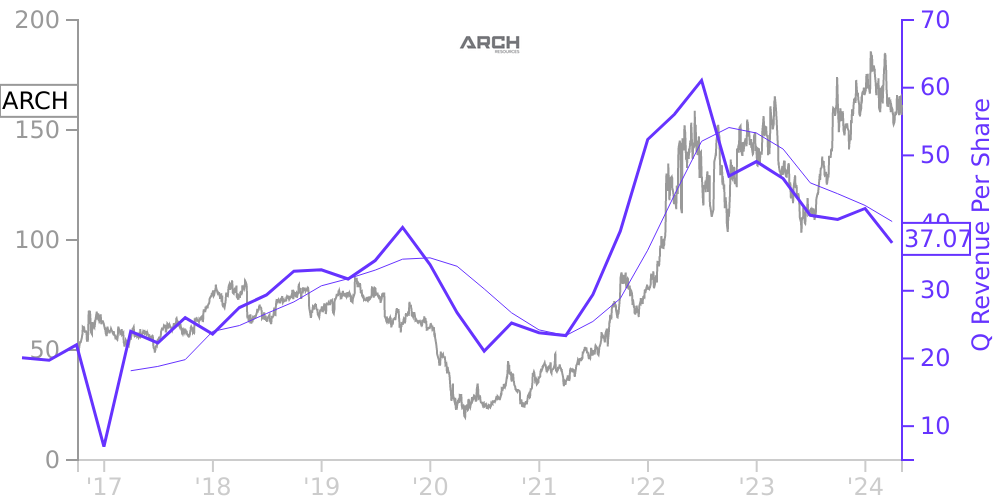
ARCH Stock Price Correlated With Arch Resources Financials
External Links ⌄
Income Statement
Cash Flow
Balance Sheet
ARCH Income Statement
Enable JavaScript and reload
Revenue, Net:
Cost of Goods & Services Sold:
Gross Profit:
Selling, General & Admin Expense:
Research & Development Expense:
Total Operating Expenses:
Operating Income:
Income Taxes:
Net Income:
ARCH Cash Flow
Enable JavaScript and reload
Operating Activities Net Income:
Depreciation, Depletion & Amortization:
Change in Accounts Receiveable:
Net Cash from Operations:
Repurchases/Buybacks Common Stock:
Issuance of Long-term Debt:
Cash Dividends Paid:
Net Cash from Financing Activities:
Property, Plant & Equipment Purchases:
Purchases of Businesses, Net of Cash:
Net Cash from Investing Activities:
Net Change in Cash & Equivalents:
ARCH Balance Sheet
Enable JavaScript and reload
Cash and Cash Equivalents:
Short-Term Investments:
Accounts Receivable, Net:
Inventories:
Total Current Assets:
Property, Plant & Equipment, Net:
Total Assets:
Accounts Payable:
Current Portion of Long-Term Debt:
Total Short-Term Liabilities:
Long Term Debt, Non-Current Portion:
Total Long-Term Liabilities:
Total Liabilities:
COMPANY PROFILE
1. Basis of Presentation The accompanying consolidated financial statements include the accounts of Arch Resources, Inc. (“Arch Resources”) and its subsidiaries and controlled entities (the “Company”). Unless the context indicates otherwise, the terms “Arch” and the “Company” are used interchangeably in this Annual Report on Form 10-K. The Company’s primary business is the production of metallurgical and thermal coal from underground and surface mines located throughout the United States, for sale to steel producers, utility companies, and industrial accounts both in the United States and around the world. The Company currently operates mining complexes in West Virginia, Wyoming and Colorado. All subsidiaries are wholly-owned. Intercompany transactions and accounts have been eliminated in consolidation.
Free historical financial statements for Arch Resources Inc.. See how revenue, income, cash flow, and balance sheet financials have changed over 59 quarters since 2010. Compare with ARCH stock chart to see long term trends.
Data imported from Arch Resources Inc. SEC filings. Check original filings before making any investment decision.