Consumer Discretionary › Retail-Eating Places

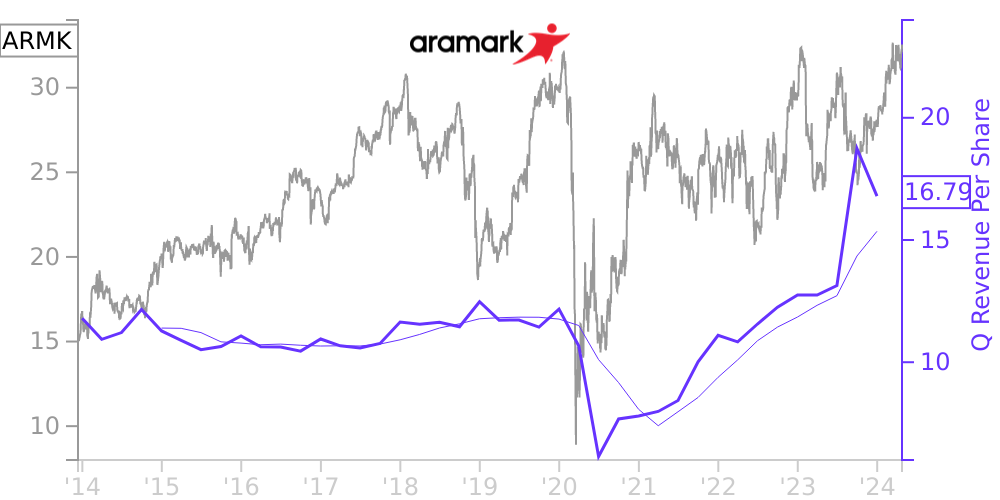
ARMK Stock Price Correlated With Aramark Financials
External Links ⌄
Income Statement
Cash Flow
Balance Sheet
ARMK Income Statement
Enable JavaScript and reload
Revenue, Net:
Cost of Goods & Services Sold:
Gross Profit:
Selling, General & Admin Expense:
Research & Development Expense:
Total Operating Expenses:
Operating Income:
Income Taxes:
Net Income:
ARMK Cash Flow
Enable JavaScript and reload
Operating Activities Net Income:
Depreciation, Depletion & Amortization:
Change in Accounts Receiveable:
Net Cash from Operations:
Repurchases/Buybacks Common Stock:
Issuance of Long-term Debt:
Cash Dividends Paid:
Net Cash from Financing Activities:
Property, Plant & Equipment Purchases:
Purchases of Businesses, Net of Cash:
Net Cash from Investing Activities:
Net Change in Cash & Equivalents:
ARMK Balance Sheet
Enable JavaScript and reload
Cash and Cash Equivalents:
Short-Term Investments:
Accounts Receivable, Net:
Inventories:
Total Current Assets:
Property, Plant & Equipment, Net:
Total Assets:
Accounts Payable:
Current Portion of Long-Term Debt:
Total Short-Term Liabilities:
Long Term Debt, Non-Current Portion:
Total Long-Term Liabilities:
Total Liabilities:
COMPANY PROFILE
BASIS OF PRESENTATION :
On January 26, 2007, ARAMARK Holdings Corporation (the “Company” or “Holdings”), a Delaware corporation controlled by investment funds associated with GS Capital Partners, CCMP Capital Advisors, J.P. Morgan Partners, Thomas H. Lee Partners and Warburg Pincus LLC (collectively, the “Sponsors”), Joseph Neubauer, Chairman and former Chief Executive Officer of the Company, and certain other members of the Company’s management, acquired all of the outstanding shares of ARAMARK Corporation (“ARAMARK Corporation”) in a going-private transaction.
On December 12, 2013, the Company began trading its common stock on the New York Stock Exchange under the symbol "ARMK" after its initial public offering ("IPO") of 28,000,000 shares of its common stock at a price of $20.00 per share (see Note 8).
The condensed consolidated financial statements include the accounts of the Company and all of its subsidiaries in which a controlling financial interest is maintained. All significant intercompany transactions and accounts have been eliminated. The Company has an ownership interest in a subsidiary with a redeemable noncontrolling interest. The Company classifies redeemable noncontrolling interests outside of stockholders' equity in the Condensed Consolidated Balance Sheets in “Common Stock Subject to Repurchase and Other.” As of December 27, 2013 and September 27, 2013 , the redeemable noncontrolling interest was approximately $ 10.1 million and $10.2 million , respectively. For the three months ended December 27, 2013 , net income attributable to redeemable noncontrolling interest was $0.2 million . Distributions to redeemable noncontrolling interest was $0.3 million for the three months ended December 27, 2013 . For the three months ended December 28, 2012 , net income attributable to redeemable noncontrolling interest was $0.2 million . Distributions to redeemable noncontrolling interest was $0.2 million for the three months ended December 28, 2012 .
The condensed consolidated financial statements included herein have been prepared by the Company pursuant to the rules and regulations of the Securities and Exchange Commission (“SEC”) and should be read in conjunction with the audited consolidated financial statements, and the notes to those statements, included in the Company's prospectus, dated December 11, 2013, filed with the SEC pursuant to Rule 424(b) of the Securities Act of 1933, on December 12, 2013. The Condensed Consolidated Balance Sheet as of September 27, 2013 was derived from audited financial statements which have been prepared in accordance with generally accepted accounting principles in the United States (“U.S. GAAP”). Certain information and footnote disclosures normally included in consolidated financial statements prepared in accordance with U.S. GAAP have been condensed or omitted pursuant to such rules and regulations, although the Company believes that the disclosures made are adequate to make the information not misleading. In the opinion of the Company, the statements include all adjustments, which are of a normal, recurring nature, required for a fair presentation for the periods presented. The results of operations for interim periods are not necessarily indicative of the results for a full year, due to the seasonality of some of the Company’s business activities and the possibility of changes in general economic conditions.
Free historical financial statements for Aramark. See how revenue, income, cash flow, and balance sheet financials have changed over 50 quarters since 2013. Compare with ARMK stock chart to see long term trends.
Data imported from Aramark SEC filings. Check original filings before making any investment decision.