Energy › Natural Gas Transmission

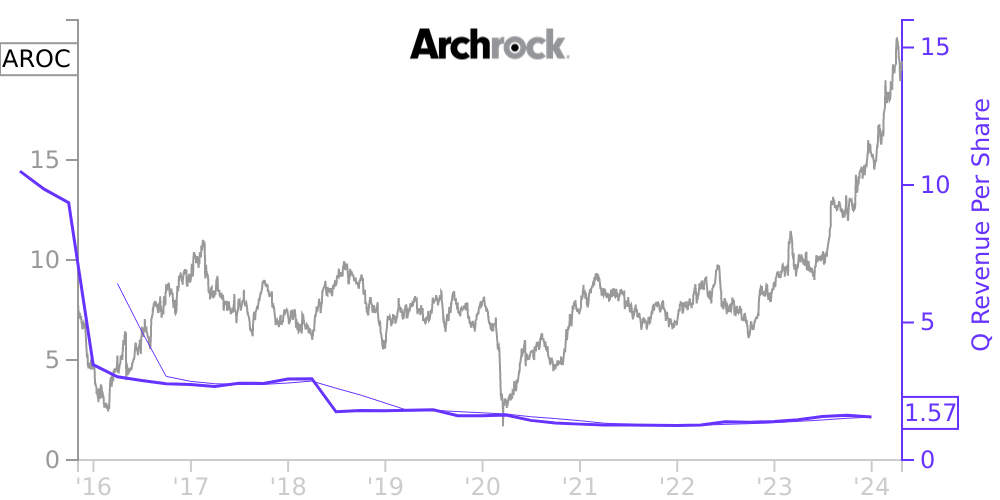
AROC Stock Price Correlated With Archrock Financials
External Links ⌄
Income Statement
Cash Flow
Balance Sheet
AROC Income Statement
Enable JavaScript and reload
Revenue, Net:
Cost of Goods & Services Sold:
Gross Profit:
Selling, General & Admin Expense:
Research & Development Expense:
Total Operating Expenses:
Operating Income:
Income Taxes:
Net Income:
AROC Cash Flow
Enable JavaScript and reload
Operating Activities Net Income:
Depreciation, Depletion & Amortization:
Change in Accounts Receiveable:
Net Cash from Operations:
Repurchases/Buybacks Common Stock:
Issuance of Long-term Debt:
Cash Dividends Paid:
Net Cash from Financing Activities:
Property, Plant & Equipment Purchases:
Purchases of Businesses, Net of Cash:
Net Cash from Investing Activities:
Net Change in Cash & Equivalents:
AROC Balance Sheet
Enable JavaScript and reload
Cash and Cash Equivalents:
Short-Term Investments:
Accounts Receivable, Net:
Inventories:
Total Current Assets:
Property, Plant & Equipment, Net:
Total Assets:
Accounts Payable:
Current Portion of Long-Term Debt:
Total Short-Term Liabilities:
Long Term Debt, Non-Current Portion:
Total Long-Term Liabilities:
Total Liabilities:
COMPANY PROFILE
1. Description of Business and Basis of Presentation We are an energy infrastructure company with a pure-play focus on midstream natural gas compression. We are the leading provider of natural gas compression services to customers in the oil and natural gas industry throughout the U.S. and a leading supplier of aftermarket services to customers that own compression equipment in the U.S. We operate in two business segments: contract operations and aftermarket services. Our predominant segment, contract operations, primarily includes designing, sourcing, owning, installing, operating, servicing, repairing and maintaining our owned fleet of natural gas compression equipment to provide natural gas compression services to our customers. In our aftermarket services business, we sell parts and components and provide operations, maintenance, overhaul and reconfiguration services to customers who own compression equipment. The accompanying unaudited condensed consolidated financial statements included herein have been prepared in accordance with GAAP and the rules and regulations of the SEC. Certain information and footnote disclosures normally included in financial statements prepared in accordance with GAAP are not required in these interim financial statements and have been condensed or omitted. Management believes that the information furnished reflects all normal recurring adjustments necessary to fairly present our consolidated financial position, results of operations and cash flows for the periods indicated. The accompanying unaudited condensed consolidated financial statements should be read in conjunction with the consolidated financial statements presented in our 2021 Form 10-K, which contains a more comprehensive summary of our accounting policies. The interim results reported herein are not necessarily indicative of results for a full year.
Free historical financial statements for Archrock Inc. See how revenue, income, cash flow, and balance sheet financials have changed over 61 quarters since 2011. Compare with AROC stock chart to see long term trends.
Data imported from Archrock Inc SEC filings. Check original filings before making any investment decision.