Technology › Wholesale-Electronic Parts And Equipment, Nec

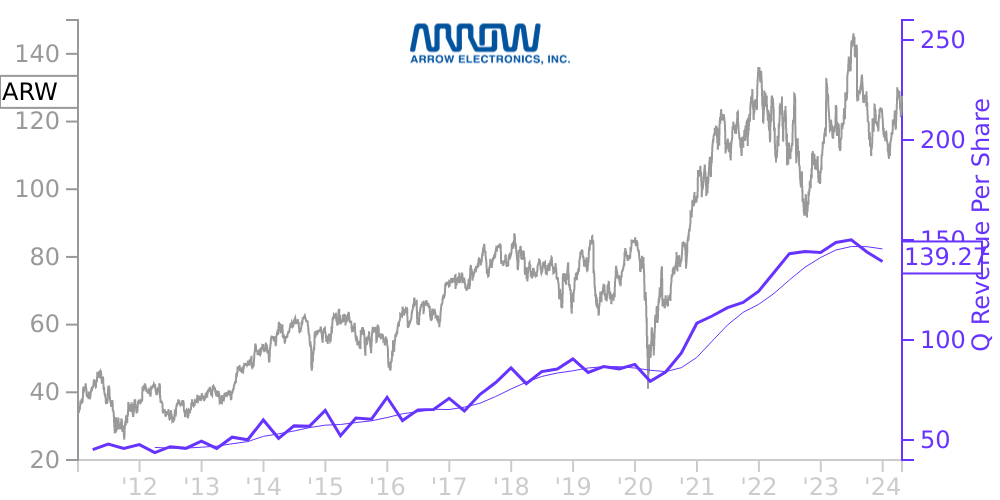
ARW Stock Price Correlated With Arrow Electronics Financials
External Links ⌄
Income Statement
Cash Flow
Balance Sheet
ARW Income Statement
Enable JavaScript and reload
Revenue, Net:
Cost of Goods & Services Sold:
Gross Profit:
Selling, General & Admin Expense:
Research & Development Expense:
Total Operating Expenses:
Operating Income:
Income Taxes:
Net Income:
ARW Cash Flow
Enable JavaScript and reload
Operating Activities Net Income:
Depreciation, Depletion & Amortization:
Change in Accounts Receiveable:
Net Cash from Operations:
Repurchases/Buybacks Common Stock:
Issuance of Long-term Debt:
Cash Dividends Paid:
Net Cash from Financing Activities:
Property, Plant & Equipment Purchases:
Purchases of Businesses, Net of Cash:
Net Cash from Investing Activities:
Net Change in Cash & Equivalents:
ARW Balance Sheet
Enable JavaScript and reload
Cash and Cash Equivalents:
Short-Term Investments:
Accounts Receivable, Net:
Inventories:
Total Current Assets:
Property, Plant & Equipment, Net:
Total Assets:
Accounts Payable:
Current Portion of Long-Term Debt:
Total Short-Term Liabilities:
Long Term Debt, Non-Current Portion:
Total Long-Term Liabilities:
Total Liabilities:
COMPANY PROFILE
Basis of Presentation The accompanying consolidated financial statements of Arrow Electronics, Inc. (the "company") were prepared in accordance with accounting principles generally accepted in the United States ("GAAP") and reflect all adjustments of a normal recurring nature, which are, in the opinion of management, necessary for a fair presentation of the consolidated financial position and results of operations at, and for the periods presented. The consolidated results of operations for the interim periods are not necessarily indicative of results for the full year.
These consolidated financial statements do not include all of the information or notes necessary for a complete presentation and, accordingly, should be read in conjunction with the company’s audited consolidated financial statements and accompanying notes for the year ended December 31, 2021, as filed in the company’s Annual Report on Form 10-K.
Quarter End
The company operates on a quarterly calendar that closes on the Saturday closest to the end of the calendar quarter, except for the fourth quarter, which closes on December 31, 2022.
Free historical financial statements for Arrow Electronics Inc. See how revenue, income, cash flow, and balance sheet financials have changed over 61 quarters since 2011. Compare with ARW stock chart to see long term trends.
Data imported from Arrow Electronics Inc SEC filings. Check original filings before making any investment decision.