Materials › Plastics Products, Nec

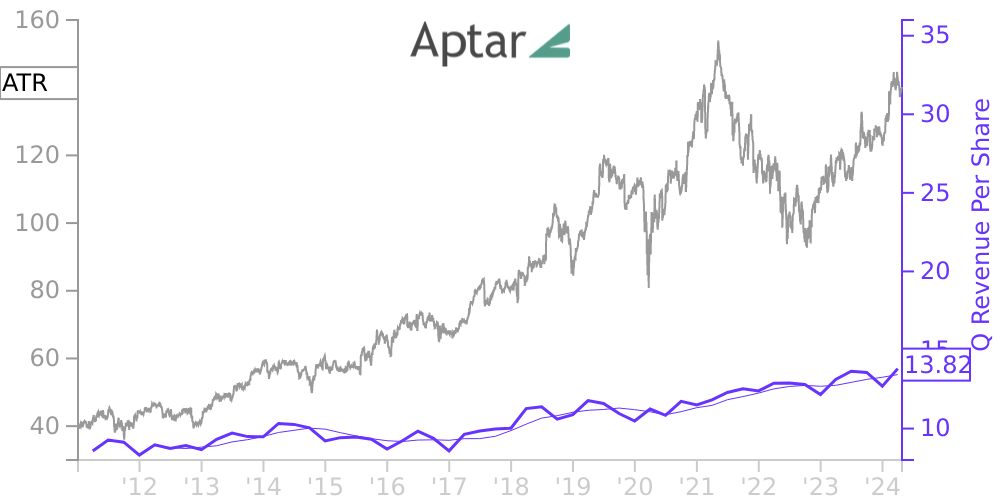
ATR Stock Price Correlated With AptarGroup Financials
External Links ⌄
Income Statement
Cash Flow
Balance Sheet
ATR Income Statement
Enable JavaScript and reload
Revenue, Net:
Cost of Goods & Services Sold:
Gross Profit:
Selling, General & Admin Expense:
Research & Development Expense:
Total Operating Expenses:
Operating Income:
Income Taxes:
Net Income:
ATR Cash Flow
Enable JavaScript and reload
Operating Activities Net Income:
Depreciation, Depletion & Amortization:
Change in Accounts Receiveable:
Net Cash from Operations:
Repurchases/Buybacks Common Stock:
Issuance of Long-term Debt:
Cash Dividends Paid:
Net Cash from Financing Activities:
Property, Plant & Equipment Purchases:
Purchases of Businesses, Net of Cash:
Net Cash from Investing Activities:
Net Change in Cash & Equivalents:
ATR Balance Sheet
Enable JavaScript and reload
Cash and Cash Equivalents:
Short-Term Investments:
Accounts Receivable, Net:
Inventories:
Total Current Assets:
Property, Plant & Equipment, Net:
Total Assets:
Accounts Payable:
Current Portion of Long-Term Debt:
Total Short-Term Liabilities:
Long Term Debt, Non-Current Portion:
Total Long-Term Liabilities:
Total Liabilities:
COMPANY PROFILE
SUMMARY OF SIGNIFICANT ACCOUNTING POLICIES BASIS OF PRESENTATION
The accompanying consolidated financial statements include the accounts of AptarGroup, Inc. and our subsidiaries. The terms “AptarGroup”, “Aptar”, “Company”, “we”, “us” or “our” as used herein refer to AptarGroup, Inc. and our subsidiaries. All significant intercompany accounts and transactions have been eliminated. Certain previously reported amounts have been reclassified to conform to the current period presentation.
AptarGroup’s organizational structure consists of three market-focused business segments which are Pharma, Beauty + Home and Food + Beverage. This is a strategic structure which allows us to be more closely aligned with our customers and the markets in which they operate.
In late 2017, we began a business transformation plan to drive profitable sales growth, increase operational excellence, enhance our approach to innovation and improve organizational effectiveness (see Note 21 – Restructuring Initiatives for further details). The primary focus of the plan is the Beauty + Home segment; however, certain global general and administrative functions have also been addressed. During 2021, 2020 and 2019, we recognized approximately $23.2 million, $26.5 million and $20.5 million, respectively, of restructuring costs related to this plan. As of December 31, 2021, we have successfully completed the vast majority of our planned initiatives related to this plan and do not expect any significant, additional restructuring expenses related to this plan.
Beginning July 1, 2018, we have applied highly inflationary accounting for our Argentinian subsidiary pursuant to U.S. GAAP. We have changed the functional currency from the Argentinian peso to the U.S. dollar. We remeasure our peso denominated assets and liabilities using the official rate. In September 2019, the President of Argentina reinstituted exchange controls restricting foreign currency purchases in an attempt to stabilize Argentina’s financial markets. As a result of these currency controls, a legal mechanism known as the Blue Chip Swap emerged in Argentina for reporting entities to transfer U.S. dollars. The Blue Chip Swap rate has diverged significantly from Argentina’s “official rate” due to the economic environment. During the second quarter of 2020, we transferred U.S. dollars into Argentina through the Blue Chip Swap method and we recognized a gain of $1.0 million. This gain helped to offset foreign currency losses due to our Argentinian peso exposure and devaluation against the U.S. dollar. During the third quarter of 2021, we utilized the Blue Chip Swap and recognized a gain of $1.4 million. Our Argentinian operations contributed less than 2.0% of consolidated net assets and revenues at and for the year ended December 31, 2021.
The extent to which the COVID-19 pandemic impacts our financial results and operations for fiscal year 2022 and going forward for all three of our business segments will depend on future developments which are highly uncertain and cannot be predicted, including the availability, adoption, and efficacy of vaccines and boosters, the length of time it takes for normal economic and operating conditions to resume, additional governmental actions that may be taken and/or extended in response to any further resurgence of the virus and numerous other uncertainties. No impairments were recorded as of December 31, 2021 related to the COVID-19 pandemic. However, due to the general uncertainty surrounding the situation, including areas such as cost inflation, supply chain disruptions, and labor shortages, future results could be negatively affected by the pandemic and therefore our results could be materially impacted.
ACCOUNTING ESTIMATES
The financial statements are prepared in conformity with accounting principles generally accepted in the United States of America (“U.S. GAAP”). This process requires management to make estimates and assumptions that affect the reported amo
Free historical financial statements for AptarGroup Inc.. See how revenue, income, cash flow, and balance sheet financials have changed over 61 quarters since 2011. Compare with ATR stock chart to see long term trends.
Data imported from AptarGroup Inc. SEC filings. Check original filings before making any investment decision.