Technology › Semiconductors And Related Devices

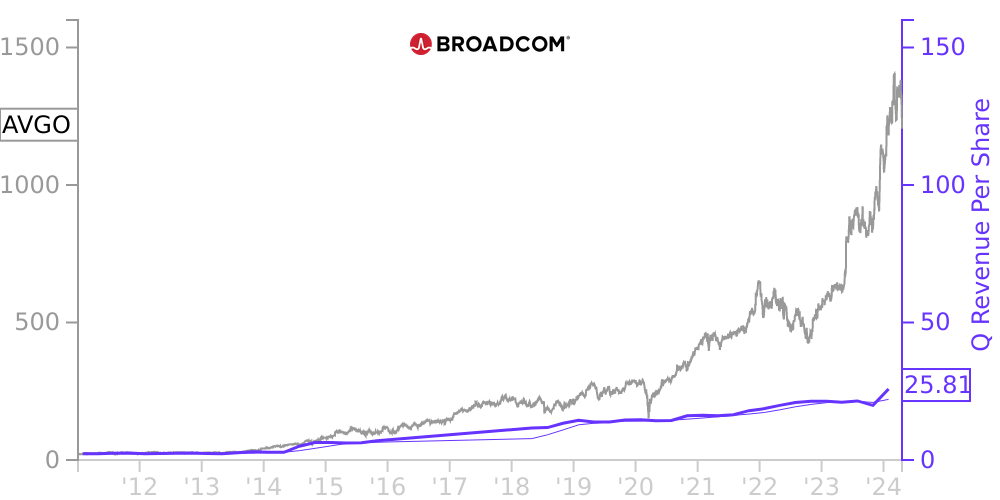
AVGO Stock Price Correlated With Broadcom Financials
External Links ⌄
Income Statement
Cash Flow
Balance Sheet
AVGO Income Statement
Enable JavaScript and reload
Revenue, Net:
Cost of Goods & Services Sold:
Gross Profit:
Selling, General & Admin Expense:
Research & Development Expense:
Total Operating Expenses:
Operating Income:
Income Taxes:
Net Income:
AVGO Cash Flow
Enable JavaScript and reload
Operating Activities Net Income:
Depreciation, Depletion & Amortization:
Change in Accounts Receiveable:
Net Cash from Operations:
Repurchases/Buybacks Common Stock:
Issuance of Long-term Debt:
Cash Dividends Paid:
Net Cash from Financing Activities:
Property, Plant & Equipment Purchases:
Purchases of Businesses, Net of Cash:
Net Cash from Investing Activities:
Net Change in Cash & Equivalents:
AVGO Balance Sheet
Enable JavaScript and reload
Cash and Cash Equivalents:
Short-Term Investments:
Accounts Receivable, Net:
Inventories:
Total Current Assets:
Property, Plant & Equipment, Net:
Total Assets:
Accounts Payable:
Current Portion of Long-Term Debt:
Total Short-Term Liabilities:
Long Term Debt, Non-Current Portion:
Total Long-Term Liabilities:
Total Liabilities:
COMPANY PROFILE
Overview and Basis of Presentation Overview
Broadcom Inc. (“Broadcom”), a Delaware corporation, is a global technology leader that designs, develops and supplies a broad range of semiconductor and infrastructure software solutions. We develop semiconductor devices with a focus on complex digital and mixed signal complementary metal oxide semiconductor based devices and analog III-V based products. We have a history of innovation in the semiconductor industry and offer thousands of products that are used in end products such as enterprise and data center networking, home connectivity, set-top boxes, broadband access, telecommunication equipment, smartphones and base stations, data center servers and storage systems, factory automation, power generation and alternative energy systems, and electronic displays. Our infrastructure software solutions enable customers to plan, develop, automate, manage and secure applications across mainframe, distributed, mobile and cloud platforms. Our portfolio of industry-leading infrastructure and security software is designed to modernize, optimize, and secure the most complex hybrid environments, enabling scalability, agility, automation, insights, resiliency and security. We also offer mission critical fibre channel storage area networking (“FC SAN”) products and related software in the form of modules, switches and subsystems incorporating multiple semiconductor products. Unless stated otherwise or the context otherwise requires, references to “Broadcom,” “we,” “our,” and “us” mean Broadcom and its consolidated subsidiaries.
Basis of Presentation
We operate on a 52- or 53-week fiscal year ending on the Sunday closest to October 31 in a 52-week year and the first Sunday in November in a 53-week year. Our fiscal year ended October 31, 2021 (“fiscal year 2021”) was a 52-week fiscal year. The first quarter of our fiscal year 2021 ended on January 31, 2021, the second quarter ended on May 2, 2021 and the third quarter ended on August 1, 2021. Our fiscal year ended November 1, 2020 (“fiscal year 2020”) and fiscal year ended November 3, 2019 (“fiscal year 2019”) were both 52-week fiscal years.
On November 4, 2019, we completed the purchase of certain assets and assumption of certain liabilities of the Symantec Corporation Enterprise Security business (the “Symantec Business”). On November 5, 2018, we acquired CA, Inc. (“CA”). The accompanying consolidated financial statements include the results of operations of the Symantec Business and CA commencing as of their respective acquisition dates. See Note 4. “Acquisitions” for additional information.
Certain reclassifications have been made to the consolidated statement of cash flows for fiscal year 2019. These reclassifications have no impact on previously reported operating, investing or financing cash flows. During the first quarter of fiscal year 2020, we changed our organizational structure, resulting in two reportable segments: semiconductor solutions and infrastructure software. Reclassifications have also been made to segment operating income. Fiscal year 2019 segment results have been recast to conform to the current presentation. See Note 13. “Segment Information” for additional information. These reclassifications have no impact on previously reported consolidated operating income.
The accompanying consolidated financial statements include the accounts of Broadcom and its subsidiaries and have been prepared in accordance with generally accepted accounting principles in the United States (“GAAP”). All intercompany balances and transactions have been eliminated in consolidation.
Free historical financial statements for Broadcom Inc. See how revenue, income, cash flow, and balance sheet financials have changed over 53 quarters since 2011. Compare with AVGO stock chart to see long term trends.
Data imported from Broadcom Inc SEC filings. Check original filings before making any investment decision.