Materials › Plastics, Materials, Synth Resins And Nonvulcan Elastomers

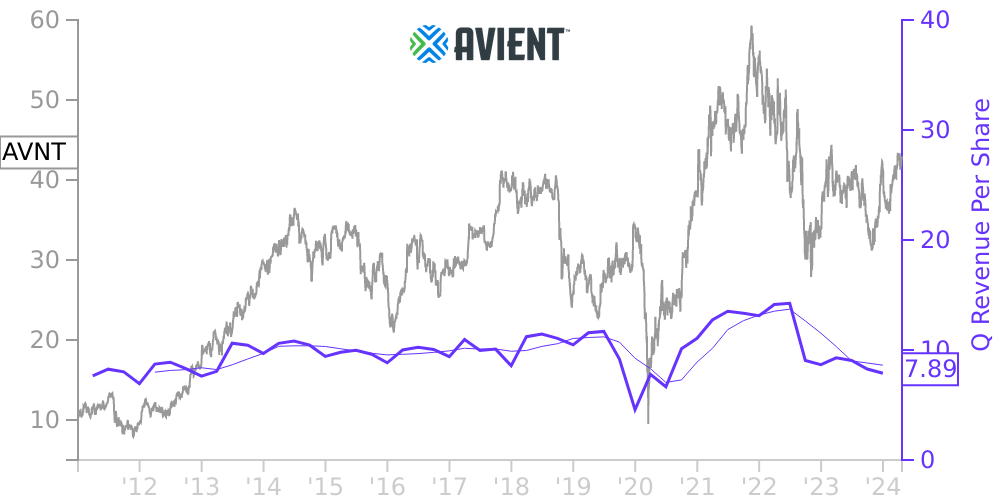
AVNT Stock Price Correlated With Avient Financials
External Links ⌄
Income Statement
Cash Flow
Balance Sheet
AVNT Income Statement
Enable JavaScript and reload
Revenue, Net:
Cost of Goods & Services Sold:
Gross Profit:
Selling, General & Admin Expense:
Research & Development Expense:
Total Operating Expenses:
Operating Income:
Income Taxes:
Net Income:
AVNT Cash Flow
Enable JavaScript and reload
Operating Activities Net Income:
Depreciation, Depletion & Amortization:
Change in Accounts Receiveable:
Net Cash from Operations:
Repurchases/Buybacks Common Stock:
Issuance of Long-term Debt:
Cash Dividends Paid:
Net Cash from Financing Activities:
Property, Plant & Equipment Purchases:
Purchases of Businesses, Net of Cash:
Net Cash from Investing Activities:
Net Change in Cash & Equivalents:
AVNT Balance Sheet
Enable JavaScript and reload
Cash and Cash Equivalents:
Short-Term Investments:
Accounts Receivable, Net:
Inventories:
Total Current Assets:
Property, Plant & Equipment, Net:
Total Assets:
Accounts Payable:
Current Portion of Long-Term Debt:
Total Short-Term Liabilities:
Long Term Debt, Non-Current Portion:
Total Long-Term Liabilities:
Total Liabilities:
COMPANY PROFILE
Note 1 — BASIS OF PRESENTATION
The accompanying unaudited condensed consolidated financial statements have been prepared in accordance with Form 10-Q instructions and in the opinion of management contain all adjustments, including those that are normal, recurring and necessary to present fairly the financial position, results of operations and cash flows for the periods presented. The preparation of financial statements in conformity with generally accepted accounting principles requires management to make estimates and assumptions that affect the amounts reported in the financial statements and accompanying notes. Actual results could differ from these estimates. These interim financial statements should be read in conjunction with the financial statements and accompanying notes included in the Annual Report on Form 10-K for the year ended December 31, 2021 of Avient Corporation, formerly known as PolyOne Corporation. When used in this Quarterly Report on Form 10-Q, the terms “we,” “us,” “our,” “Avient” and the “Company” mean Avient Corporation and its consolidated subsidiaries.
Operating results for the three and six months ended June 30, 2022 are not necessarily indicative of the results that may be attained in subsequent periods or for the year ending December 31, 2022.
Free historical financial statements for Avient Corp. See how revenue, income, cash flow, and balance sheet financials have changed over 61 quarters since 2011. Compare with AVNT stock chart to see long term trends.
Data imported from Avient Corp SEC filings. Check original filings before making any investment decision.