Industrials › Aircraft

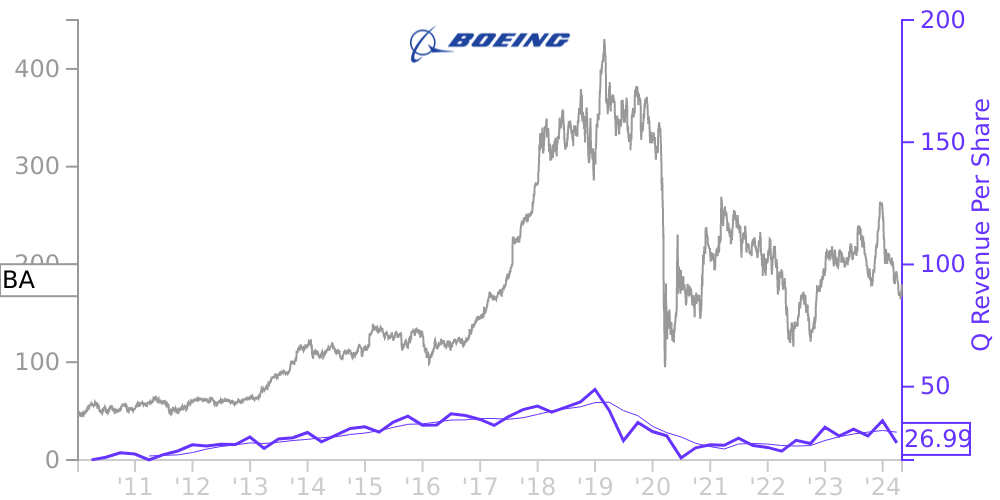
BA Stock Price Correlated With Boeing Co Financials
External Links ⌄
Income Statement
Cash Flow
Balance Sheet
BA Income Statement
Enable JavaScript and reload
Revenue, Net:
Cost of Goods & Services Sold:
Gross Profit:
Selling, General & Admin Expense:
Research & Development Expense:
Total Operating Expenses:
Operating Income:
Income Taxes:
Net Income:
BA Cash Flow
Enable JavaScript and reload
Operating Activities Net Income:
Depreciation, Depletion & Amortization:
Change in Accounts Receiveable:
Net Cash from Operations:
Repurchases/Buybacks Common Stock:
Issuance of Long-term Debt:
Cash Dividends Paid:
Net Cash from Financing Activities:
Property, Plant & Equipment Purchases:
Purchases of Businesses, Net of Cash:
Net Cash from Investing Activities:
Net Change in Cash & Equivalents:
BA Balance Sheet
Enable JavaScript and reload
Cash and Cash Equivalents:
Short-Term Investments:
Accounts Receivable, Net:
Inventories:
Total Current Assets:
Property, Plant & Equipment, Net:
Total Assets:
Accounts Payable:
Current Portion of Long-Term Debt:
Total Short-Term Liabilities:
Long Term Debt, Non-Current Portion:
Total Long-Term Liabilities:
Total Liabilities:
COMPANY PROFILE
Basis of Presentation The condensed consolidated interim financial statements included in this report have been prepared by management of The Boeing Company (herein referred to as “Boeing”, the “Company”, “we”, “us”, or “our”). In the opinion of management, all adjustments (consisting of normal recurring accruals) necessary for a fair presentation are reflected in the interim financial statements. The results of operations for the period ended June 30, 2022 are not necessarily indicative of the operating results for the full year. The interim financial statements should be read in conjunction with the audited Consolidated Financial Statements, including the notes thereto, included in our 2021 Annual Report on Form 10-K.
Liquidity Matters
During the first six months of 2022, net cash used by operating activities was $3.1 billion. Our operating cash flows continue to be impacted by lower commercial airplane deliveries and concessions paid to 737 MAX customers. We expect a negative impact on our operating cash flows until commercial deliveries ramp up. As a result, our cash and short-term investment balance was $11.4 billion at June 30, 2022, down from $16.2 billion at December 31, 2021. Our debt balance of $57.2 billion at June 30, 2022 is down from $58.1 billion at December 31, 2021. Short-term debt and the current portion of long-term debt increased to $5.4 billion at June 30, 2022 from $1.3 billion at December 31, 2021. The current portion of long-term debt includes term notes of $0.3 billion maturing in the fourth quarter of 2022, $1.7 billion maturing in the first quarter of 2023, and $3.4 billion maturing in the second quarter of 2023.
As of June 30, 2022, our unused borrowing capacity on revolving credit agreements is $14.7 billion, unchanged from December 31, 2021. We anticipate that these credit lines will remain undrawn and primarily serve as back-up liquidity to support our general corporate borrowing needs. Our borrowing capacity includes $6.3 billion scheduled to expire in October 2022, of which $3.1 billion has a one-year term out option that allows us to extend the maturity of any borrowings one additional year.
Our short-term and long-term credit ratings remained unchanged during the first half of 2022. There is risk for future downgrades.
At June 30, 2022 and December 31, 2021, trade payables included $2.4 billion and $2.3 billion payable to suppliers who have elected to participate in supply chain financing programs. We do not believe that future changes in the availability of supply chain financing will have a significant impact on our liquidity.
Based on our current best estimates of market demand, planned production rates, timing of cash receipts and expenditures, our ability to successfully implement further actions to improve liquidity, as well as our ability to access additional liquidity, if needed, we believe it is probable that we will be able to fund our operations for the foreseeable future.
Use of Estimates
The preparation of financial statements in conformity with U.S. generally accepted accounting principles (GAAP) requires management to make estimates and assumptions that affect the reported amounts of assets and liabilities and disclosure of contingent assets and liabilities at the date of the financial statements and the reported amounts of revenues and expenses during the reporting period. We believe that the accounting estimates and assumptions are appropriate, however, given the increased uncertainties surrounding the severity and duration of the impacts of the COVID-19 pandemic actual results could differ from those estimates.
Long-term Contracts
Changes in estimated revenues, cost of sales, and the related effect on operating income are recognized using a cumulative catch-up adjustment which recognizes in the current period the cumulative effect of the changes on current and prior periods based on a long-term contract’s percentage-of-completion. When the current estimates of tota
Free historical financial statements for Boeing Co.. See how revenue, income, cash flow, and balance sheet financials have changed over 65 quarters since 2010. Compare with BA stock chart to see long term trends.
Data imported from Boeing Co. SEC filings. Check original filings before making any investment decision.