Technology › Drawing And Insulating Nonferrous Wire

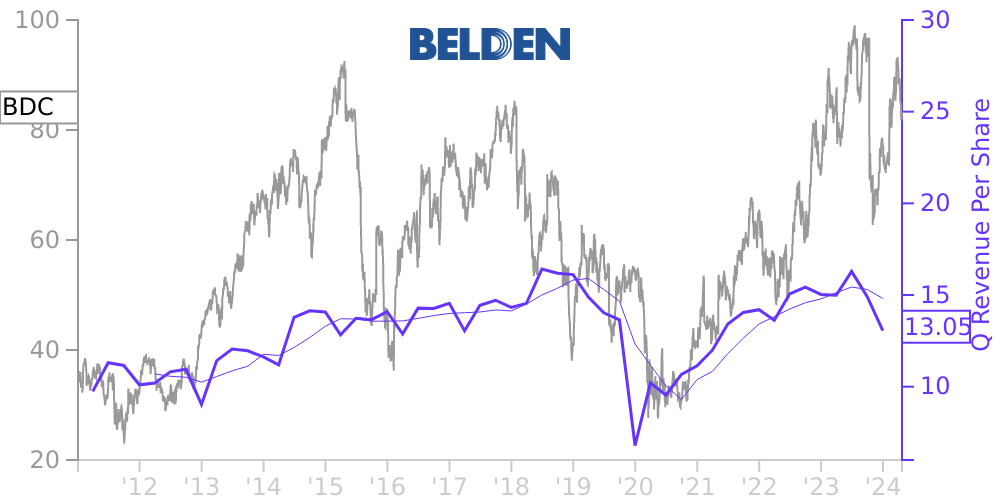
BDC Stock Price Correlated With Belden Financials
External Links ⌄
Income Statement
Cash Flow
Balance Sheet
BDC Income Statement
Enable JavaScript and reload
Revenue, Net:
Cost of Goods & Services Sold:
Gross Profit:
Selling, General & Admin Expense:
Research & Development Expense:
Total Operating Expenses:
Operating Income:
Income Taxes:
Net Income:
BDC Cash Flow
Enable JavaScript and reload
Operating Activities Net Income:
Depreciation, Depletion & Amortization:
Change in Accounts Receiveable:
Net Cash from Operations:
Repurchases/Buybacks Common Stock:
Issuance of Long-term Debt:
Cash Dividends Paid:
Net Cash from Financing Activities:
Property, Plant & Equipment Purchases:
Purchases of Businesses, Net of Cash:
Net Cash from Investing Activities:
Net Change in Cash & Equivalents:
BDC Balance Sheet
Enable JavaScript and reload
Cash and Cash Equivalents:
Short-Term Investments:
Accounts Receivable, Net:
Inventories:
Total Current Assets:
Property, Plant & Equipment, Net:
Total Assets:
Accounts Payable:
Current Portion of Long-Term Debt:
Total Short-Term Liabilities:
Long Term Debt, Non-Current Portion:
Total Long-Term Liabilities:
Total Liabilities:
COMPANY PROFILE
Basis of Presentation Business Description
Belden Inc. (the Company, us, we, or our) is a global supplier of specialty networking solutions built around two global businesses – Enterprise Solutions and Industrial Solutions. Our comprehensive portfolio of solutions enables customers to transmit and secure data, sound, and video for mission critical applications across complex enterprise and industrial environments.
Consolidation
The accompanying Consolidated Financial Statements include Belden Inc. and all of its subsidiaries, including variable interest entities for which we are the primary beneficiary. We eliminate all significant affiliate accounts and transactions in consolidation.
Foreign Currency
For international operations with functional currencies other than the United States (U.S.) dollar, we translate assets and liabilities at current exchange rates; we translate income and expenses using average exchange rates. We report the resulting translation adjustments, as well as gains and losses from certain affiliate transactions, in accumulated other comprehensive income (loss), a separate component of stockholders’ equity. We include exchange gains and losses on transactions in operating income.
We determine the functional currency of our foreign subsidiaries based upon the currency of the primary economic environment in which each subsidiary operates. Typically, that is determined by the currency in which the subsidiary primarily generates and expends cash. We have concluded that the local currency is the functional currency for all of our material subsidiaries.
Reporting Periods
Our fiscal year and fiscal fourth quarter both end on December 31. Our fiscal first quarter ends on the Sunday falling closest to 91 days after December 31. Our fiscal second and third quarters each have 91 days.
Use of Estimates in the Preparation of the Financial Statements
The preparation of financial statements in conformity with accounting principles generally accepted in the U.S. requires us to make estimates and assumptions that affect the reported amounts of assets, liabilities, and operating results and the disclosure of contingencies. Actual results could differ from those estimates. We make significant estimates with respect to the collectability and valuation of receivables, the valuation of inventory, the realization of deferred tax assets, the valuation of goodwill and indefinite-lived intangible assets, the valuation of contingent liabilities, the calculation of share-based compensation, the calculation of pension and other postretirement benefits expense, and the valuation of acquired businesses.
Free historical financial statements for Belden Inc. See how revenue, income, cash flow, and balance sheet financials have changed over 61 quarters since 2011. Compare with BDC stock chart to see long term trends.
Data imported from Belden Inc SEC filings. Check original filings before making any investment decision.