Consumer Discretionary › Retail-Eating Places

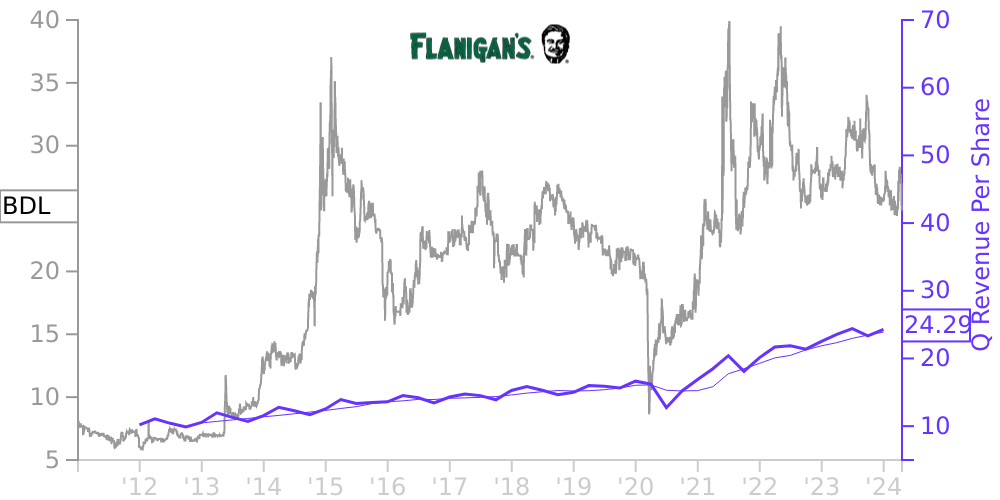
BDL Stock Price Correlated With Flanigan's Enterprises Financials
External Links ⌄
Income Statement
Cash Flow
Balance Sheet
BDL Income Statement
Enable JavaScript and reload
Revenue, Net:
Cost of Goods & Services Sold:
Gross Profit:
Selling, General & Admin Expense:
Research & Development Expense:
Total Operating Expenses:
Operating Income:
Income Taxes:
Net Income:
BDL Cash Flow
Enable JavaScript and reload
Operating Activities Net Income:
Depreciation, Depletion & Amortization:
Change in Accounts Receiveable:
Net Cash from Operations:
Repurchases/Buybacks Common Stock:
Issuance of Long-term Debt:
Cash Dividends Paid:
Net Cash from Financing Activities:
Property, Plant & Equipment Purchases:
Purchases of Businesses, Net of Cash:
Net Cash from Investing Activities:
Net Change in Cash & Equivalents:
BDL Balance Sheet
Enable JavaScript and reload
Cash and Cash Equivalents:
Short-Term Investments:
Accounts Receivable, Net:
Inventories:
Total Current Assets:
Property, Plant & Equipment, Net:
Total Assets:
Accounts Payable:
Current Portion of Long-Term Debt:
Total Short-Term Liabilities:
Long Term Debt, Non-Current Portion:
Total Long-Term Liabilities:
Total Liabilities:
COMPANY PROFILE
(1) BASIS OF PRESENTATION: The accompanying condensed consolidated
financial information for the thirteen weeks ended December 31, 2022 and January 1, 2022 is unaudited. Financial information as of
October 1, 2022 has been derived from the audited financial statements of Flanigan’s Enterprises, Inc., a Florida corporation,
together with its subsidiaries, (the “Company”, “we”, “our”, “ours” and
“us” as the context requires), but does not include all disclosures required by accounting principles generally accepted
in the United States of America. In the opinion of management, all adjustments, consisting of normal recurring adjustments,
necessary for a fair presentation of the financial information for the periods indicated have been included. For further information
regarding the Company's accounting policies, refer to the Consolidated Financial Statements and related notes included in the
Company's Annual Report on Form 10-K for the year ended October 1, 2022. Operating results for interim periods are not necessarily
indicative of results to be expected for a full year. The condensed consolidated financial statements include
the accounts of the Company, its wholly-owned subsidiaries and the accounts of the ten limited partnerships in which we act as general
partner and have controlling interests. All intercompany balances and transactions have been eliminated. Non-controlling interest represents
the limited partners’ proportionate share of the net assets and results of operations of the eight limited partnerships. The consolidated financial statements and related disclosures for condensed
interim reporting are prepared in conformity with accounting principles generally accepted in the United States. We are required to make
estimates and assumptions that affect the reported amounts of assets and liabilities, the disclosure of contingent assets and liabilities
at the date of the financial statements, and revenue and expenses during the period reported. These estimates include assessing
the estimated useful lives of tangible assets, the recognition of deferred tax assets and liabilities and estimates relating to the calculation
of incremental borrowing rates and length of leases associated with right-of-use assets and corresponding liabilities and estimates relating
to loyalty reward programs. Estimates and assumptions are reviewed periodically and the effects of revisions are reflected in our
consolidated financial statements in the period they are determined to be necessary. Although these estimates are based on our knowledge
of current events and actions we may undertake in the future, they may ultimately differ from actual results. Although these estimates are based on management’s
knowledge of current events and actions it may take in the future, they may ultimately differ from actual results. Certain amounts presented in the financial statements previously issued
for the thirteen weeks ended January 1, 2022 have been reclassified to conform to the presentation for the thirteen weeks ended December
31, 2022.
Free historical financial statements for Flanigan's Enterprises Inc.. See how revenue, income, cash flow, and balance sheet financials have changed over 58 quarters since 2011. Compare with BDL stock chart to see long term trends.
Data imported from Flanigan's Enterprises Inc. SEC filings. Check original filings before making any investment decision.