Materials › Plastics Products, Nec

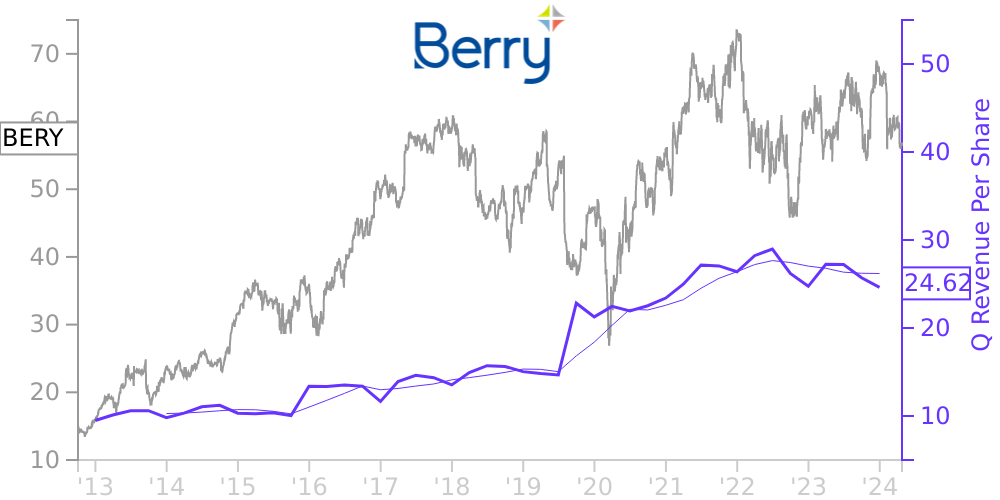
BERY Stock Price Correlated With Berry Global Financials
External Links ⌄
Income Statement
Cash Flow
Balance Sheet
BERY Income Statement
Enable JavaScript and reload
Revenue, Net:
Cost of Goods & Services Sold:
Gross Profit:
Selling, General & Admin Expense:
Research & Development Expense:
Total Operating Expenses:
Operating Income:
Income Taxes:
Net Income:
BERY Cash Flow
Enable JavaScript and reload
Operating Activities Net Income:
Depreciation, Depletion & Amortization:
Change in Accounts Receiveable:
Net Cash from Operations:
Repurchases/Buybacks Common Stock:
Issuance of Long-term Debt:
Cash Dividends Paid:
Net Cash from Financing Activities:
Property, Plant & Equipment Purchases:
Purchases of Businesses, Net of Cash:
Net Cash from Investing Activities:
Net Change in Cash & Equivalents:
BERY Balance Sheet
Enable JavaScript and reload
Cash and Cash Equivalents:
Short-Term Investments:
Accounts Receivable, Net:
Inventories:
Total Current Assets:
Property, Plant & Equipment, Net:
Total Assets:
Accounts Payable:
Current Portion of Long-Term Debt:
Total Short-Term Liabilities:
Long Term Debt, Non-Current Portion:
Total Long-Term Liabilities:
Total Liabilities:
COMPANY PROFILE
1. Basis of Presentation
The accompanying unaudited Condensed Consolidated Financial Statements of Berry Global Group, Inc.
(“the Company,” “we,” or “Berry”) have been prepared in accordance with accounting principles generally accepted in the United States (“GAAP”) pursuant to the rules and regulations of the Securities and Exchange Commission for interim reporting.
Accordingly, they do not include all of the information and footnotes required by GAAP for complete financial statements . In preparing financial statements in conformity with GAAP, we must make estimates and assumptions that affect the reported amounts and disclosures at the date of the financial statements and during the reporting
period. Actual results could differ from those estimates. The Company’s U.S. based results for fiscal 2022 and fiscal 2021 are based on a fifty-two and fifty-three
week period, respectively. The extra week in fiscal 2021 occurred in the first quarter. The Company has recast certain prior period amounts to conform to current reporting. In the opinion of management, all adjustments (consisting of normal recurring adjustments) considered necessary for a fair presentation have been included, and all subsequent
events up to the time of the filing have been evaluated. For further information, refer to the Company’s most recent Form 10-K filed with the Securities and Exchange Commission.
Free historical financial statements for Berry Global Group Inc. See how revenue, income, cash flow, and balance sheet financials have changed over 50 quarters since 2012. Compare with BERY stock chart to see long term trends.
Data imported from Berry Global Group Inc SEC filings. Check original filings before making any investment decision.