Consumer Discretionary › Printing Trades Machinery And Equipment

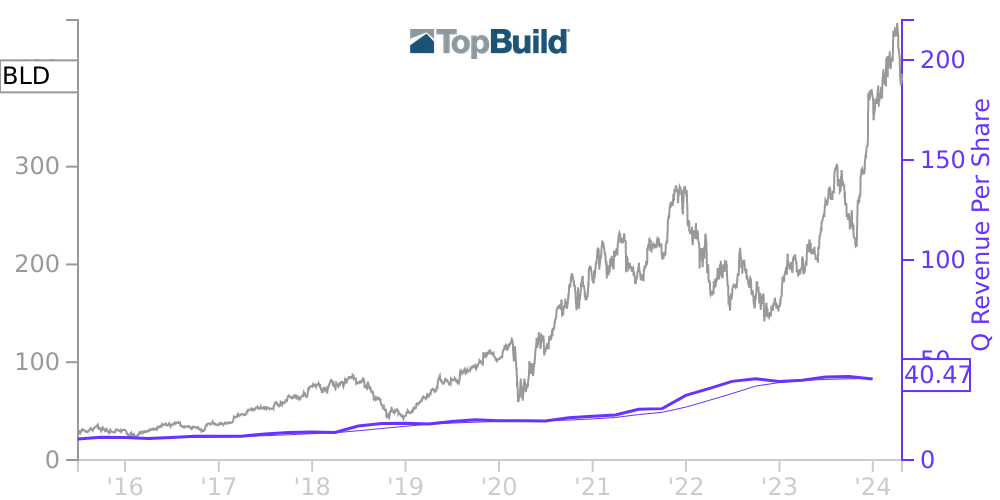
BLD Stock Price Correlated With TopBuild Financials
External Links ⌄
Income Statement
Cash Flow
Balance Sheet
BLD Income Statement
Enable JavaScript and reload
Revenue, Net:
Cost of Goods & Services Sold:
Gross Profit:
Selling, General & Admin Expense:
Research & Development Expense:
Total Operating Expenses:
Operating Income:
Income Taxes:
Net Income:
BLD Cash Flow
Enable JavaScript and reload
Operating Activities Net Income:
Depreciation, Depletion & Amortization:
Change in Accounts Receiveable:
Net Cash from Operations:
Repurchases/Buybacks Common Stock:
Issuance of Long-term Debt:
Cash Dividends Paid:
Net Cash from Financing Activities:
Property, Plant & Equipment Purchases:
Purchases of Businesses, Net of Cash:
Net Cash from Investing Activities:
Net Change in Cash & Equivalents:
BLD Balance Sheet
Enable JavaScript and reload
Cash and Cash Equivalents:
Short-Term Investments:
Accounts Receivable, Net:
Inventories:
Total Current Assets:
Property, Plant & Equipment, Net:
Total Assets:
Accounts Payable:
Current Portion of Long-Term Debt:
Total Short-Term Liabilities:
Long Term Debt, Non-Current Portion:
Total Long-Term Liabilities:
Total Liabilities:
COMPANY PROFILE
1. SUMMARY OF SIGNIFICANT ACCOUNTING POLICIES Basis of Presentation. TopBuild is a Delaware corporation and trades on the NYSE under the symbol “BLD.” We report our business in two segments: Installation and Specialty Distribution. Our Installation segment primarily installs insulation and other building products. Our Specialty Distribution segment primarily sells and distributes insulation and other building products. Our segments are based on our operating units, for which financial information is regularly evaluated by our Chief Operating Decision Maker. Financial Statement Presentation. The consolidated financial statements have been developed in conformity with GAAP. All significant intercompany transactions between the TopBuild entities have been eliminated. Use of Estimates and Assumptions in the Preparation of Financial Statements. The preparation of our consolidated financial statements in conformity with GAAP requires us to make certain estimates and assumptions that affect the reported amounts of assets and liabilities, and disclosure of any contingent assets and liabilities, at the date of the financial statements, and the reported amounts of sales and expenses during the reporting period. Actual results may differ from these estimates and assumptions. Revenue Recognition. Revenue is disaggregated between our Installation and Specialty Distribution segments. A reconciliation of disaggregated revenue by segment is included in Note 8 – Segment Information. We recognize revenue for our Installation segment over time as the related performance obligation is satisfied with respect to each particular order within a given customer’s contract. Progress toward complete satisfaction of the performance obligation is measured using a cost-to-cost measure of progress method. The cost input is based on the amount of material installed at that customer’s location and the associated labor costs, as compared to the total expected cost for the particular order. The total expected cost is a significant estimate in the revenue recognition process, requires judgment, and is subject to variability throughout the duration of the contract as a result of contract modifications and other circumstances impacting job completion. Generally, this results in revenue being recognized as the customer is able to receive and utilize the benefits provided by our services. Each contract contains one or more individual orders, which are based on services delivered. When material and installation services are bundled in a contract, we combine these items into one performance obligation as the overall promise is to transfer the combined item. Revenue from our Specialty Distribution segment is recognized when title to products and risk of loss transfers to our customers. This represents the point in time when the customer is able to direct the use of and obtain substantially all the benefits from the product. The determination of when control is deemed transferred depends on the shipping terms that are agreed upon in the contract. At time of sale, we record estimated reductions to revenue for customer programs and incentive offerings, including special pricing and other volume-based incentives based on historical experience, which is continuously adjusted. The duration of our contracts with customers is relatively short, generally less than a 90-day period, therefore there is not a significant financing component when considering the determination of the transaction price which gets allocated to the individual performance obligations, generally based on standalone selling prices. Additionally, we consider shipping costs charged to a customer as a fulfillment cost rather than a promised service and expense as incurred. Sales taxes, when incurred, are recorded as a liability and excluded from revenue on a net basis. We record a contract asset when we have satisfied our performance obligation prior to billing and a contract liability whe
Free historical financial statements for TopBuild Corp.. See how revenue, income, cash flow, and balance sheet financials have changed over 44 quarters since 2015. Compare with BLD stock chart to see long term trends.
Data imported from TopBuild Corp. SEC filings. Check original filings before making any investment decision.