Consumer Discretionary › Retail-Eating Places

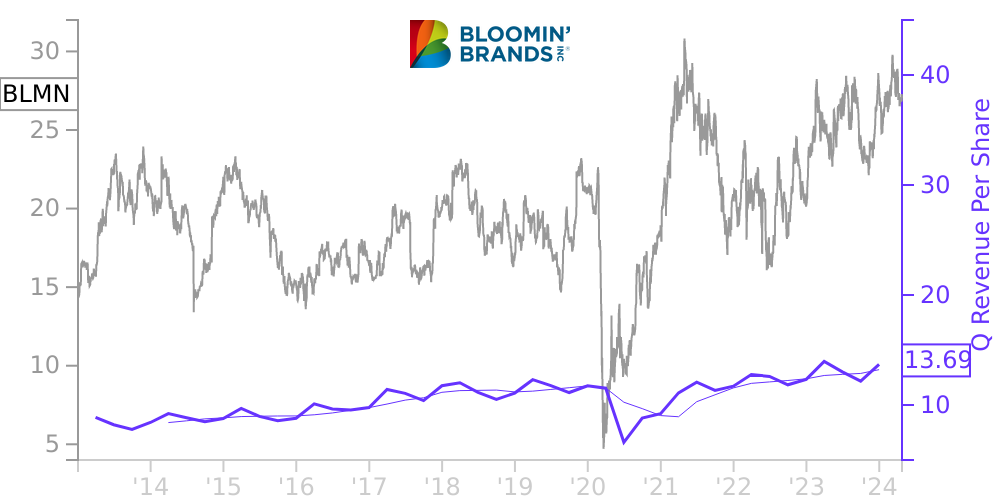
BLMN Stock Price Correlated With Bloomin' Brands Financials
External Links ⌄
Income Statement
Cash Flow
Balance Sheet
BLMN Income Statement
Enable JavaScript and reload
Revenue, Net:
Cost of Goods & Services Sold:
Gross Profit:
Selling, General & Admin Expense:
Research & Development Expense:
Total Operating Expenses:
Operating Income:
Income Taxes:
Net Income:
BLMN Cash Flow
Enable JavaScript and reload
Operating Activities Net Income:
Depreciation, Depletion & Amortization:
Change in Accounts Receiveable:
Net Cash from Operations:
Repurchases/Buybacks Common Stock:
Issuance of Long-term Debt:
Cash Dividends Paid:
Net Cash from Financing Activities:
Property, Plant & Equipment Purchases:
Purchases of Businesses, Net of Cash:
Net Cash from Investing Activities:
Net Change in Cash & Equivalents:
BLMN Balance Sheet
Enable JavaScript and reload
Cash and Cash Equivalents:
Short-Term Investments:
Accounts Receivable, Net:
Inventories:
Total Current Assets:
Property, Plant & Equipment, Net:
Total Assets:
Accounts Payable:
Current Portion of Long-Term Debt:
Total Short-Term Liabilities:
Long Term Debt, Non-Current Portion:
Total Long-Term Liabilities:
Total Liabilities:
COMPANY PROFILE
Description of Business Bloomin’ Brands, Inc. (“Bloomin’ Brands” or the “Company”), a holding company that conducts its operations through its subsidiaries, is one of the largest casual dining restaurant companies in the world, with a portfolio of leading, differentiated restaurant concepts. OSI Restaurant Partners, LLC (“OSI”) is the Company’s primary operating entity.
The Company owns and operates casual, upscale casual and fine dining restaurants. The Company’s restaurant portfolio has four concepts: Outback Steakhouse, Carrabba’s Italian Grill, Bonefish Grill and Fleming’s Prime Steakhouse & Wine Bar. Additional Outback Steakhouse, Carrabba’s Italian Grill and Bonefish Grill restaurants in which the Company has no direct investment are operated under franchise agreements.
The Company owns and operates casual, upscale casual and fine dining restaurants. The Company’s restaurant portfolio has four concepts: Outback Steakhouse, Carrabba’s Italian Grill, Bonefish Grill and Fleming’s Prime Steakhouse & Wine Bar. Additional Outback Steakhouse, Carrabba’s Italian Grill and Bonefish Grill restaurants in which the Company has no direct investment are operated under franchise agreements.
Free historical financial statements for Bloomin' Brands Inc.. See how revenue, income, cash flow, and balance sheet financials have changed over 53 quarters since 2013. Compare with BLMN stock chart to see long term trends.
Data imported from Bloomin' Brands Inc. SEC filings. Check original filings before making any investment decision.