Industrials › Power, Distribution And Specialty Transformers

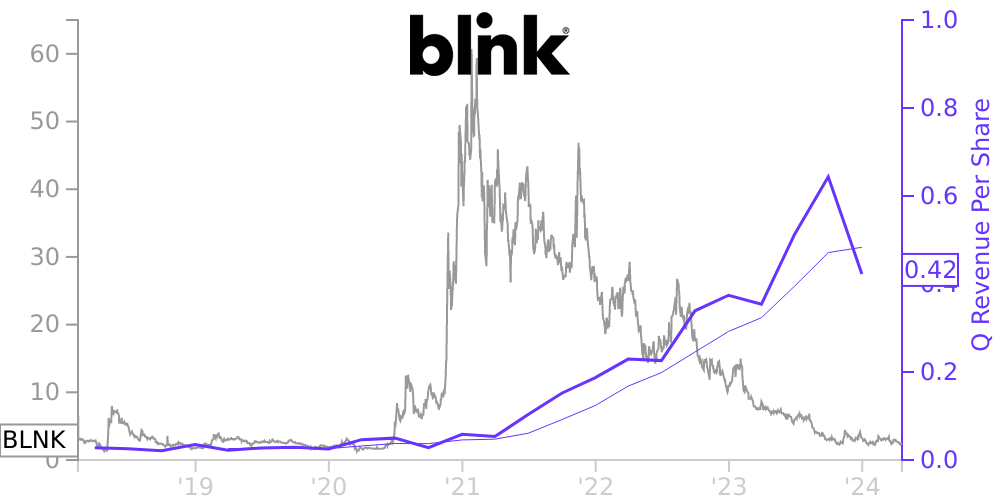
BLNK Stock Price Correlated With Blink Charging Co Financials
External Links ⌄
Income Statement
Cash Flow
Balance Sheet
BLNK Income Statement
Enable JavaScript and reload
Revenue, Net:
Cost of Goods & Services Sold:
Gross Profit:
Selling, General & Admin Expense:
Research & Development Expense:
Total Operating Expenses:
Operating Income:
Income Taxes:
Net Income:
BLNK Cash Flow
Enable JavaScript and reload
Operating Activities Net Income:
Depreciation, Depletion & Amortization:
Change in Accounts Receiveable:
Net Cash from Operations:
Repurchases/Buybacks Common Stock:
Issuance of Long-term Debt:
Cash Dividends Paid:
Net Cash from Financing Activities:
Property, Plant & Equipment Purchases:
Purchases of Businesses, Net of Cash:
Net Cash from Investing Activities:
Net Change in Cash & Equivalents:
BLNK Balance Sheet
Enable JavaScript and reload
Cash and Cash Equivalents:
Short-Term Investments:
Accounts Receivable, Net:
Inventories:
Total Current Assets:
Property, Plant & Equipment, Net:
Total Assets:
Accounts Payable:
Current Portion of Long-Term Debt:
Total Short-Term Liabilities:
Long Term Debt, Non-Current Portion:
Total Long-Term Liabilities:
Total Liabilities:
COMPANY PROFILE
Blink
Charging Co., through its wholly-owned subsidiaries (collectively, the “Company” or “Blink”), is a leading owner,
operator, and provider of electric vehicle (“EV”) charging equipment and networked EV charging services. Blink offers residential
and commercial EV charging equipment, enabling EV drivers to recharge at various location types. Blink’s principal line of products
and services is its Blink EV charging network (the “Blink Network”) and Blink EV charging equipment, also known as electric
vehicle supply equipment (“EVSE”) and other EV-related services. The Blink Network provides property owners, managers, parking
companies, and state and municipal entities (“Property Partners”) with cloud-based services that enable the remote monitoring
and management of EV charging stations. The Blink Network also provides EV drivers with vital station information, including station
location, availability and fees. Blink also operates a ride-sharing program through the Company’s wholly owned subsidiary, BlueLA
Rideshare, LLC and the City of Los Angeles which allows customers the ability to rent electric vehicles through a subscription service.
Free historical financial statements for Blink Charging Co.. See how revenue, income, cash flow, and balance sheet financials have changed over 37 quarters since 2016. Compare with BLNK stock chart to see long term trends.
Data imported from Blink Charging Co. SEC filings. Check original filings before making any investment decision.