Industrials › Miscellaneous Manufacturing Industries

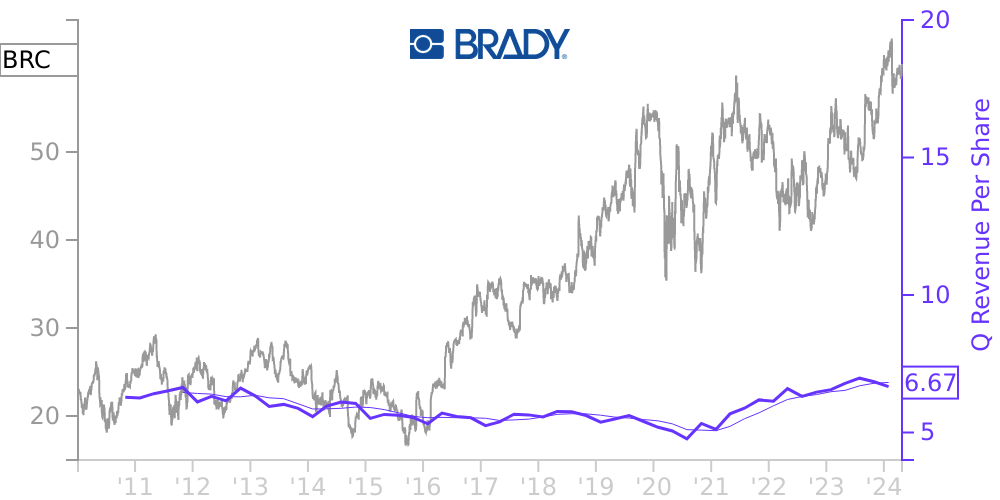
BRC Stock Price Correlated With Brady Financials
External Links ⌄
Income Statement
Cash Flow
Balance Sheet
BRC Income Statement
Enable JavaScript and reload
Revenue, Net:
Cost of Goods & Services Sold:
Gross Profit:
Selling, General & Admin Expense:
Research & Development Expense:
Total Operating Expenses:
Operating Income:
Income Taxes:
Net Income:
BRC Cash Flow
Enable JavaScript and reload
Operating Activities Net Income:
Depreciation, Depletion & Amortization:
Change in Accounts Receiveable:
Net Cash from Operations:
Repurchases/Buybacks Common Stock:
Issuance of Long-term Debt:
Cash Dividends Paid:
Net Cash from Financing Activities:
Property, Plant & Equipment Purchases:
Purchases of Businesses, Net of Cash:
Net Cash from Investing Activities:
Net Change in Cash & Equivalents:
BRC Balance Sheet
Enable JavaScript and reload
Cash and Cash Equivalents:
Short-Term Investments:
Accounts Receivable, Net:
Inventories:
Total Current Assets:
Property, Plant & Equipment, Net:
Total Assets:
Accounts Payable:
Current Portion of Long-Term Debt:
Total Short-Term Liabilities:
Long Term Debt, Non-Current Portion:
Total Long-Term Liabilities:
Total Liabilities:
COMPANY PROFILE
Basis of Presentation The condensed consolidated financial statements included herein have been prepared by Brady Corporation and subsidiaries (the "Company," "Brady," "we," or "our") without audit, pursuant to the rules and regulations of the Securities and Exchange Commission. In the opinion of the Company, the foregoing statements contain all adjustments, consisting only of normal recurring adjustments necessary to present fairly the financial position of the Company as of April 30, 2022 and July 31, 2021, its results of operations and comprehensive income for the three and nine months ended April 30, 2022 and 2021, and cash flows for the nine months ended April 30, 2022 and 2021. The condensed consolidated balance sheet as of July 31, 2021, has been derived from the audited consolidated financial statements as of that date. The preparation of financial statements in conformity with accounting principles generally accepted in the United States of America (“GAAP”) requires management to make estimates and assumptions that affect the reported amounts therein. Due to the inherent uncertainty involved in making estimates, actual results in future periods may differ from the estimates.
Certain information and footnote disclosures normally included in financial statements prepared in accordance with GAAP have been omitted pursuant to rules and regulations of the Securities and Exchange Commission. Accordingly, the condensed consolidated financial statements do not include all of the information and footnotes required by GAAP for complete financial statement presentation. It is suggested that these condensed consolidated financial statements be read in conjunction with the consolidated financial statements and the notes thereto included in the Company’s Annual Report on Form 10-K for the year ended July 31, 2021.
Certain information and footnote disclosures normally included in financial statements prepared in accordance with GAAP have been omitted pursuant to rules and regulations of the Securities and Exchange Commission. Accordingly, the condensed consolidated financial statements do not include all of the information and footnotes required by GAAP for complete financial statement presentation. It is suggested that these condensed consolidated financial statements be read in conjunction with the consolidated financial statements and the notes thereto included in the Company’s Annual Report on Form 10-K for the year ended July 31, 2021.
Free historical financial statements for Brady Corp. See how revenue, income, cash flow, and balance sheet financials have changed over 63 quarters since 2010. Compare with BRC stock chart to see long term trends.
Data imported from Brady Corp SEC filings. Check original filings before making any investment decision.