Consumer Discretionary › Retail-Eating & Drinking Places

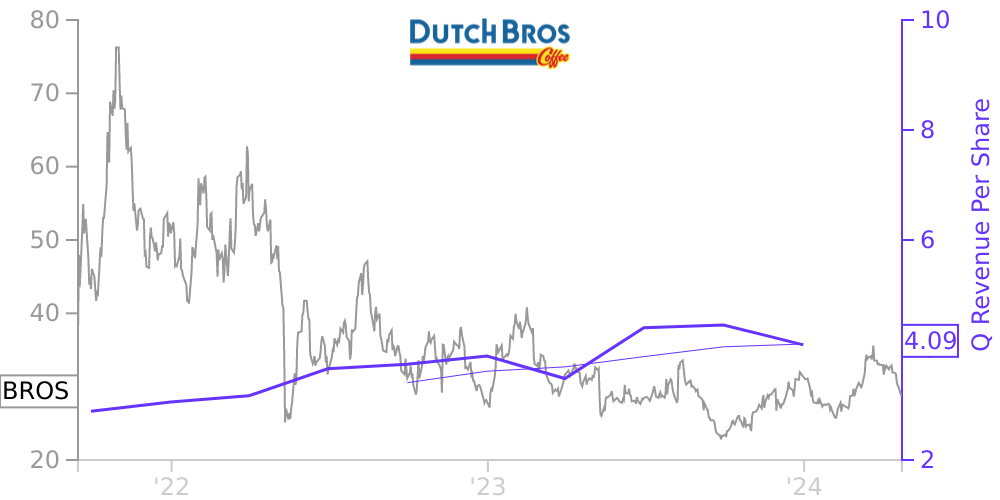
BROS Stock Price Correlated With Dutch Bros Financials
External Links ⌄
Income Statement
Cash Flow
Balance Sheet
BROS Income Statement
Enable JavaScript and reload
Revenue, Net:
Cost of Goods & Services Sold:
Gross Profit:
Selling, General & Admin Expense:
Research & Development Expense:
Total Operating Expenses:
Operating Income:
Income Taxes:
Net Income:
BROS Cash Flow
Enable JavaScript and reload
Operating Activities Net Income:
Depreciation, Depletion & Amortization:
Change in Accounts Receiveable:
Net Cash from Operations:
Repurchases/Buybacks Common Stock:
Issuance of Long-term Debt:
Cash Dividends Paid:
Net Cash from Financing Activities:
Property, Plant & Equipment Purchases:
Purchases of Businesses, Net of Cash:
Net Cash from Investing Activities:
Net Change in Cash & Equivalents:
BROS Balance Sheet
Enable JavaScript and reload
Cash and Cash Equivalents:
Short-Term Investments:
Accounts Receivable, Net:
Inventories:
Total Current Assets:
Property, Plant & Equipment, Net:
Total Assets:
Accounts Payable:
Current Portion of Long-Term Debt:
Total Short-Term Liabilities:
Long Term Debt, Non-Current Portion:
Total Long-Term Liabilities:
Total Liabilities:
COMPANY PROFILE
NOTE 1 — Organization and Background
Business
Dutch Bros Inc. (the Company) is in the business of operating and franchising drive-thru coffee shops as well as the wholesale and distribution of coffee, coffee-related products and accessories. As of March 31, 2022, there were 572 shops in operation in 12 U.S. states, of which 310 were company-operated and 262 were franchised.
Organization
Dutch Bros Inc. was formed on June 4, 2021 as a Delaware corporation for the purpose of facilitating an IPO and other related transactions in order to carry on the business of Dutch Bros OpCo. The Company is the sole managing member of Dutch Bros OpCo and operates and controls all of the business and affairs of Dutch Bros OpCo. As a result, the Company consolidates the financial results of Dutch Bros OpCo and reports a non-controlling interest representing the economic interest in Dutch Bros OpCo held by the other members of Dutch Bros OpCo. The Company’s fiscal year end is December 31.
As of March 31, 2022, the Company held 100.0% of the voting interest and 32.8% of the economic interest of Dutch Bros OpCo. The Continuing Members held none of the voting interest and the remaining 67.2% of the economic interest of Dutch Bros OpCo.
Initial Public Offering
On September 17, 2021, the Company completed its IPO of approximately 24.2 million shares of Class A common stock at a public offering price of $23.00 per share, which included approximately 3.2 million shares issued pursuant to the exercise in full of the underwriters’ option to purchase additional shares. The Company received proceeds of approximately $520.8 million, net of offering costs. The proceeds were used to purchase approximately 10.9 million newly-issued Class A common units from Dutch Bros OpCo for approximately $234.4 million. The proceeds were also used to purchase approximately 11.7 million Class A common units from the Continuing Members for approximately $253.3 million, and approximately 1.6 million shares of Class D common stock from the Pre-IPO Blocker Holders for approximately $34.4 million.
Reorganization Transactions
In connection with the IPO, the Company completed the following transactions (the Reorganization Transactions):
• Amended and restated the Second Dutch Bros OpCo Agreement to, among other things, effect a recapitalization in which (i) the outstanding Common Units were converted into Class A common units paired with an equal number of either Class B voting units or Class C voting units, and (ii) the outstanding Profits Interest (PI) Units were converted into Class A common units.
• Amended and restated the Company’s certificate of incorporation to, among other things, authorize four classes of common stock.
• Acquired Class A common units and Class C voting units indirectly held by the Pre-IPO Blocker Holders in exchange for shares of Class D common stock.
• Pre-IPO Dutch Bros OpCo Unitholders’ contribution of Class A common units, Class B voting units, and Class C voting units to the Company in exchange for Class A common stock, Class B common stock, and Class C common stock, respectively.
• The Company’s designation as managing member of Dutch Bros OpCo. •Entered into two tax receivable agreements (Tax Receivable Agreements or TRAs), which provide for payment by Dutch Bros PubCo to the Continuing Members and the Pre-IPO Blocker Holders of 85% of the benefits, if any, that Dutch Bros PubCo would be deemed to realize (calculated using certain assumptions) as a result of certain tax attributes and benefits covered by the TRAs.
Free historical financial statements for Dutch Bros Inc.. See how revenue, income, cash flow, and balance sheet financials have changed over 19 quarters since 2021. Compare with BROS stock chart to see long term trends.
Data imported from Dutch Bros Inc. SEC filings. Check original filings before making any investment decision.