Energy › Bituminous Coal And Lignite Surface Mining

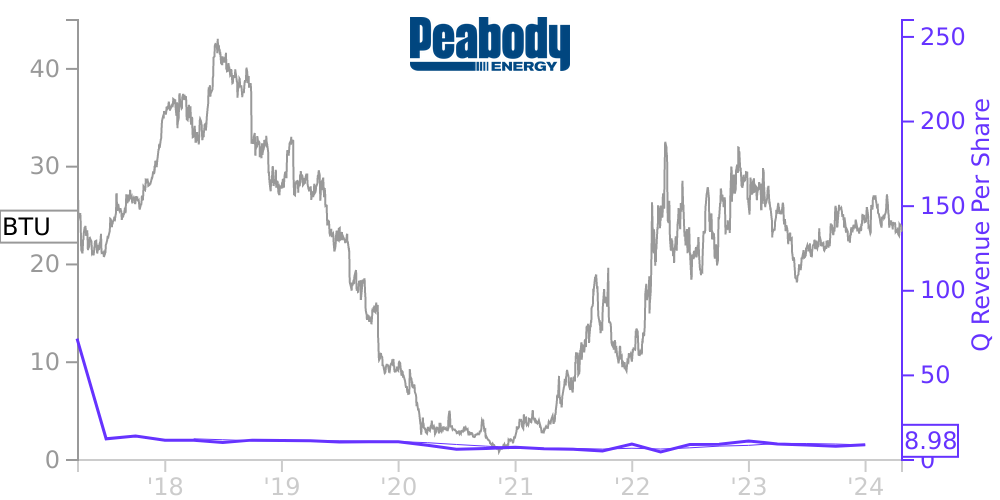
BTU Stock Price Correlated With Peabody Energy Financials
External Links ⌄
Income Statement
Cash Flow
Balance Sheet
BTU Income Statement
Enable JavaScript and reload
Revenue, Net:
Cost of Goods & Services Sold:
Gross Profit:
Selling, General & Admin Expense:
Research & Development Expense:
Total Operating Expenses:
Operating Income:
Income Taxes:
Net Income:
BTU Cash Flow
Enable JavaScript and reload
Operating Activities Net Income:
Depreciation, Depletion & Amortization:
Change in Accounts Receiveable:
Net Cash from Operations:
Repurchases/Buybacks Common Stock:
Issuance of Long-term Debt:
Cash Dividends Paid:
Net Cash from Financing Activities:
Property, Plant & Equipment Purchases:
Purchases of Businesses, Net of Cash:
Net Cash from Investing Activities:
Net Change in Cash & Equivalents:
BTU Balance Sheet
Enable JavaScript and reload
Cash and Cash Equivalents:
Short-Term Investments:
Accounts Receivable, Net:
Inventories:
Total Current Assets:
Property, Plant & Equipment, Net:
Total Assets:
Accounts Payable:
Current Portion of Long-Term Debt:
Total Short-Term Liabilities:
Long Term Debt, Non-Current Portion:
Total Long-Term Liabilities:
Total Liabilities:
COMPANY PROFILE
Basis of Presentation The condensed consolidated financial statements include the accounts of Peabody Energy Corporation (PEC) and its consolidated subsidiaries and affiliates (along with PEC, the Company or Peabody). Interests in subsidiaries controlled by the Company are consolidated with any outside stockholder interests reflected as noncontrolling interests, except when the Company has an undivided interest in a joint venture. In those cases, the Company includes its proportionate share in the assets, liabilities, revenue and expenses of the jointly controlled entities within each applicable line item of the unaudited condensed consolidated financial statements. All intercompany transactions, profits and balances have been eliminated in consolidation.
The accompanying unaudited condensed consolidated financial statements have been prepared in accordance with accounting principles generally accepted in the United States (U.S. GAAP) for interim financial information and with the instructions to Form 10-Q and Article 10 of Regulation S-X. Accordingly, they do not include all of the information and footnotes required by U.S. GAAP for complete financial statements and should be read in conjunction with the consolidated financial statements and notes thereto included in the Company’s Annual Report on Form 10-K for the year ended December 31, 2021. In the opinion of management, these financial statements reflect all normal, recurring adjustments necessary for a fair presentation. Balance sheet information presented herein as of December 31, 2021 has been derived from the Company’s audited consolidated balance sheet at that date. The Company’s results of operations for the three months ended March 31, 2022 are not necessarily indicative of the results that may be expected for future quarters or for the year ending December 31, 2022.
The accompanying unaudited condensed consolidated financial statements have been prepared in accordance with accounting principles generally accepted in the United States (U.S. GAAP) for interim financial information and with the instructions to Form 10-Q and Article 10 of Regulation S-X. Accordingly, they do not include all of the information and footnotes required by U.S. GAAP for complete financial statements and should be read in conjunction with the consolidated financial statements and notes thereto included in the Company’s Annual Report on Form 10-K for the year ended December 31, 2021. In the opinion of management, these financial statements reflect all normal, recurring adjustments necessary for a fair presentation. Balance sheet information presented herein as of December 31, 2021 has been derived from the Company’s audited consolidated balance sheet at that date. The Company’s results of operations for the three months ended March 31, 2022 are not necessarily indicative of the results that may be expected for future quarters or for the year ending December 31, 2022.
Free historical financial statements for Peabody Energy Corp. See how revenue, income, cash flow, and balance sheet financials have changed over 65 quarters since 2010. Compare with BTU stock chart to see long term trends.
Data imported from Peabody Energy Corp SEC filings. Check original filings before making any investment decision.