Consumer Discretionary › Motor Vehicle Parts And Accessories

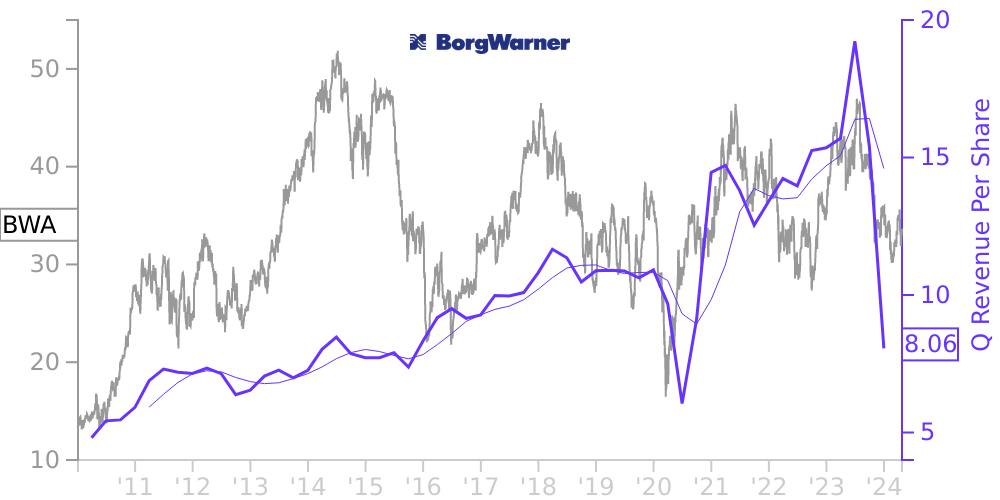
BWA Stock Price Correlated With BorgWarner Financials
External Links ⌄
Income Statement
Cash Flow
Balance Sheet
BWA Income Statement
Enable JavaScript and reload
Revenue, Net:
Cost of Goods & Services Sold:
Gross Profit:
Selling, General & Admin Expense:
Research & Development Expense:
Total Operating Expenses:
Operating Income:
Income Taxes:
Net Income:
BWA Cash Flow
Enable JavaScript and reload
Operating Activities Net Income:
Depreciation, Depletion & Amortization:
Change in Accounts Receiveable:
Net Cash from Operations:
Repurchases/Buybacks Common Stock:
Issuance of Long-term Debt:
Cash Dividends Paid:
Net Cash from Financing Activities:
Property, Plant & Equipment Purchases:
Purchases of Businesses, Net of Cash:
Net Cash from Investing Activities:
Net Change in Cash & Equivalents:
BWA Balance Sheet
Enable JavaScript and reload
Cash and Cash Equivalents:
Short-Term Investments:
Accounts Receivable, Net:
Inventories:
Total Current Assets:
Property, Plant & Equipment, Net:
Total Assets:
Accounts Payable:
Current Portion of Long-Term Debt:
Total Short-Term Liabilities:
Long Term Debt, Non-Current Portion:
Total Long-Term Liabilities:
Total Liabilities:
COMPANY PROFILE
BASIS OF PRESENTATION The accompanying unaudited Condensed Consolidated Financial Statements of BorgWarner Inc. and Consolidated Subsidiaries (the “Company”) have been prepared in accordance with accounting principles generally accepted in the United States of America (“GAAP”) for interim financial information and with the instructions to Form 10-Q and Rule 10-01 of Regulation S-X. Accordingly, they do not include all of the information and footnotes necessary for a comprehensive presentation of financial position, results of operations and cash flow activity required by GAAP for complete financial statements. In the opinion of management, all normal recurring adjustments necessary for a fair statement of results have been included. Certain prior period amounts have been reclassified to conform to the current period presentation. Operating results for the three months ended March 31, 2022 are not necessarily indicative of the results that may be expected for the year ending December 31, 2022. The balance sheet as of December 31, 2021 was derived from the audited financial statements as of that date. For further information, refer to the Consolidated Financial Statements and Footnotes thereto included in the Company’s Annual Report on Form 10-K for the year ended December 31, 2021.
Management makes estimates and assumptions that affect the reported amounts of assets and liabilities and disclosure of contingent assets and liabilities as of the date of the financial statements and accompanying notes, as well as the amounts of revenues and expenses reported during the periods covered by those financial statements and accompanying notes. Actual results could differ from these estimates.
COVID-19 Pandemic and Other Supply Disruptions
Industry production levels were challenged during 2021 primarily as a result of COVID-19 related constrained supply of components, particularly semiconductor chips. The Company expects production levels to modestly increase during 2022, however these improvements could be partially offset by various global disruptions, including but not limited to, input cost inflation, supply chain shutdowns, a potential more widespread resurgence of COVID-19 and impacts from Russia’s invasion of Ukraine.
Free historical financial statements for BorgWarner Inc.. See how revenue, income, cash flow, and balance sheet financials have changed over 65 quarters since 2010. Compare with BWA stock chart to see long term trends.
Data imported from BorgWarner Inc. SEC filings. Check original filings before making any investment decision.