Materials › Miscellaneous Chemical Products

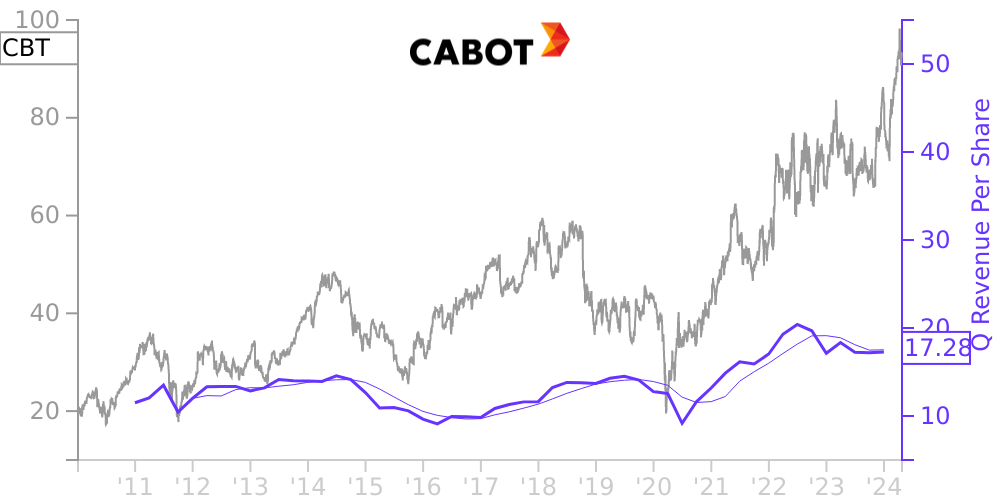
CBT Stock Price Correlated With Cabot Financials
External Links ⌄
Income Statement
Cash Flow
Balance Sheet
CBT Income Statement
Enable JavaScript and reload
Revenue, Net:
Cost of Goods & Services Sold:
Gross Profit:
Selling, General & Admin Expense:
Research & Development Expense:
Total Operating Expenses:
Operating Income:
Income Taxes:
Net Income:
CBT Cash Flow
Enable JavaScript and reload
Operating Activities Net Income:
Depreciation, Depletion & Amortization:
Change in Accounts Receiveable:
Net Cash from Operations:
Repurchases/Buybacks Common Stock:
Issuance of Long-term Debt:
Cash Dividends Paid:
Net Cash from Financing Activities:
Property, Plant & Equipment Purchases:
Purchases of Businesses, Net of Cash:
Net Cash from Investing Activities:
Net Change in Cash & Equivalents:
CBT Balance Sheet
Enable JavaScript and reload
Cash and Cash Equivalents:
Short-Term Investments:
Accounts Receivable, Net:
Inventories:
Total Current Assets:
Property, Plant & Equipment, Net:
Total Assets:
Accounts Payable:
Current Portion of Long-Term Debt:
Total Short-Term Liabilities:
Long Term Debt, Non-Current Portion:
Total Long-Term Liabilities:
Total Liabilities:
COMPANY PROFILE
A. Basis of Presentation
The consolidated financial statements have been prepared in conformity with accounting policies generally accepted in the United States (“U.S.”) and include the accounts of Cabot Corporation (“Cabot” or the “Company”) and its wholly-owned subsidiaries and majority-owned and controlled U.S. and non-U.S. subsidiaries. Additionally, Cabot considers consolidation of entities over which control is achieved through means other than voting rights. Intercompany transactions have been eliminated in consolidation.
The unaudited consolidated financial statements have been prepared in accordance with the requirements of Form 10-Q and consequently do not include all disclosures required by Form 10-K. Additional information may be obtained by referring to Cabot’s Annual Report on Form 10-K for its fiscal year ended September 30, 2021 (“2021 10-K”).
The financial information submitted herewith is unaudited and reflects all adjustments which are, in the opinion of management, necessary to provide a fair statement of the results for the interim periods ended March 31, 2022 and 2021. All such adjustments are of a normal recurring nature. The results for interim periods are not necessarily indicative of the results to be expected for the fiscal year.
As discussed in Note C, on February 28, 2022, the Company acquired Tokai Carbon (Tianjin) Co. (“Tokai Carbon”). The results of operations and cash flows of Tokai Carbon are included in the Company’s consolidated financial statements from the date of acquisition.
As discussed in Note D, on March 1, 2022, the Company completed the sale of its Purification Solutions business to an affiliate of funds advised by One Equity Partners (“OEP”). The sale of the Purification Solutions business did not meet the criteria to be reported as a discontinued operation as it did not constitute a significant strategic business shift for the Company, and has no major effect on operations. Therefore, prior periods’ consolidated financial statements and disclosures have not been retroactively restated to reflect the impact of the sale of the Purification Solutions business.
Free historical financial statements for Cabot Corp. See how revenue, income, cash flow, and balance sheet financials have changed over 62 quarters since 2010. Compare with CBT stock chart to see long term trends.
Data imported from Cabot Corp SEC filings. Check original filings before making any investment decision.