Technology › Retail-Catalog And Mail-Order Houses

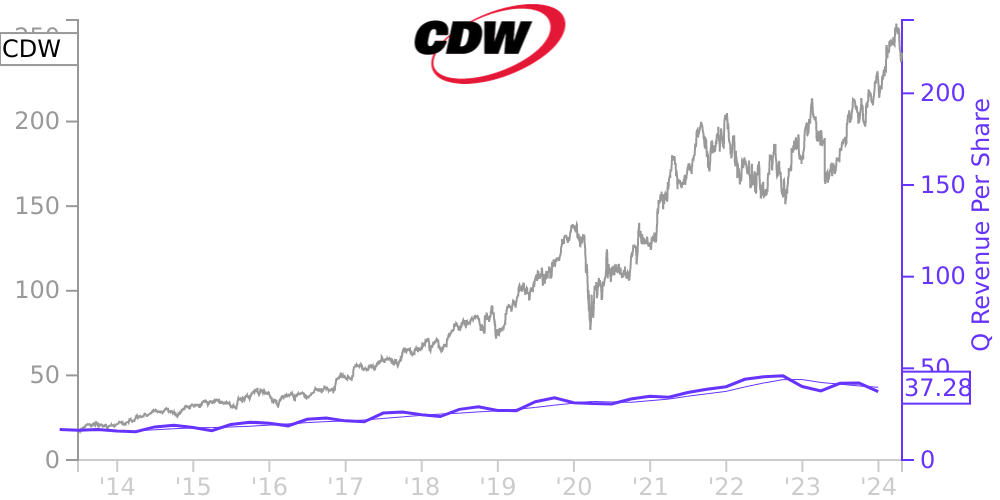
CDW Stock Price Correlated With CDW Financials
External Links ⌄
Income Statement
Cash Flow
Balance Sheet
CDW Income Statement
Enable JavaScript and reload
Revenue, Net:
Cost of Goods & Services Sold:
Gross Profit:
Selling, General & Admin Expense:
Research & Development Expense:
Total Operating Expenses:
Operating Income:
Income Taxes:
Net Income:
CDW Cash Flow
Enable JavaScript and reload
Operating Activities Net Income:
Depreciation, Depletion & Amortization:
Change in Accounts Receiveable:
Net Cash from Operations:
Repurchases/Buybacks Common Stock:
Issuance of Long-term Debt:
Cash Dividends Paid:
Net Cash from Financing Activities:
Property, Plant & Equipment Purchases:
Purchases of Businesses, Net of Cash:
Net Cash from Investing Activities:
Net Change in Cash & Equivalents:
CDW Balance Sheet
Enable JavaScript and reload
Cash and Cash Equivalents:
Short-Term Investments:
Accounts Receivable, Net:
Inventories:
Total Current Assets:
Property, Plant & Equipment, Net:
Total Assets:
Accounts Payable:
Current Portion of Long-Term Debt:
Total Short-Term Liabilities:
Long Term Debt, Non-Current Portion:
Total Long-Term Liabilities:
Total Liabilities:
COMPANY PROFILE
Description of Business and Summary of Significant Accounting Policies Description of Business
CDW Corporation (“Parent”), a Fortune 500 company and member of the S&P 500 Index, is a leading multi-brand provider of information technology (“IT”) solutions to small, medium and large business, government, education and healthcare customers in the United States (“US”), the United Kingdom (“UK”) and Canada. The Company’s broad array of offerings ranges from discrete hardware and software products to integrated IT solutions and services that include on-premise, hybrid and cloud capabilities across hybrid infrastructure, digital experience and security.
Throughout this report, the terms “the Company” and “CDW” refer to Parent and its 100% owned subsidiaries.
Parent has two 100% owned subsidiaries, CDW LLC and CDW Finance Corporation. CDW LLC is an Illinois limited liability company that, together with its 100% owned subsidiaries, holds all material assets and conducts all business activities and operations of the Company. CDW Finance Corporation is a Delaware corporation formed for the sole purpose of acting as co-issuer of certain debt obligations and does not hold any material assets or engage in any business activities or operations.
Significant Accounting Policies
Basis of Presentation
The Consolidated Financial Statements have been prepared in conformity with accounting principles generally accepted in the United States of America (“US GAAP”) and the rules and regulations of the US Securities and Exchange Commission (“SEC”). The Company’s Consolidated Financial Statements are based on a fiscal year ended December 31.
Principles of Consolidation
The Consolidated Financial Statements include the accounts of Parent and its 100% owned subsidiaries. All intercompany transactions and accounts are eliminated in consolidation.
On October 15, 2021, the Company entered into a Purchase and Sale Agreement (the “Purchase Agreement”) to acquire all issued and outstanding equity interests in Granite Parent, Inc., the parent company of Sirius Computer Solutions, Inc. (“Sirius”), for a base purchase price of $2.5 billion in cash, subject to customary closing adjustments. On December 1, 2021, the Company completed its acquisition of Sirius. The Company included the financial results of Sirius in its Consolidated Financial Statements from the date of the acquisition. For additional information on the acquisition of Sirius, refer to Note 3 (Acquisitions).
Reclassifications
Certain prior period amounts included in the Financing activities of the Consolidated Statements of Cash Flows have been reclassified to conform with the current period presentation.
Use of Estimates
The preparation of the Consolidated Financial Statements in accordance with US GAAP requires management to make certain estimates and assumptions that affect the reported amounts of assets and liabilities and disclosure of contingent assets and liabilities as of the date of the Consolidated Financial Statements and the reported amounts of revenue and expenses during the reported periods. The Company bases its estimates on historical experience and on various other assumptions that management believes are reasonable under the circumstances, the results of which form the basis for making judgments about carrying values of assets and liabilities that are not readily apparent from other sources. Actual results and outcomes could differ from those estimates.
Except as noted within Note 2 (Recent Accounting Pronouncements) for the adoption of Accounting Standards Update (“ASU”) 2019-12, Income Taxes (Topic 740): Simplifying the Accounting for Income Taxes, there have been no changes to the Company’s significant accounting policies and estimates during the year ended December 31, 2021.
Business Combinations
The Company accounts for business combinations using the acquisition method of accounting, which allocates the fair value of the purchase consideration to the tangible an
Free historical financial statements for CDW Corp. See how revenue, income, cash flow, and balance sheet financials have changed over 57 quarters since 2012. Compare with CDW stock chart to see long term trends.
Data imported from CDW Corp SEC filings. Check original filings before making any investment decision.