Materials › Plastic Material, Synth Resin/Rubber, Cellulos (No Glass)

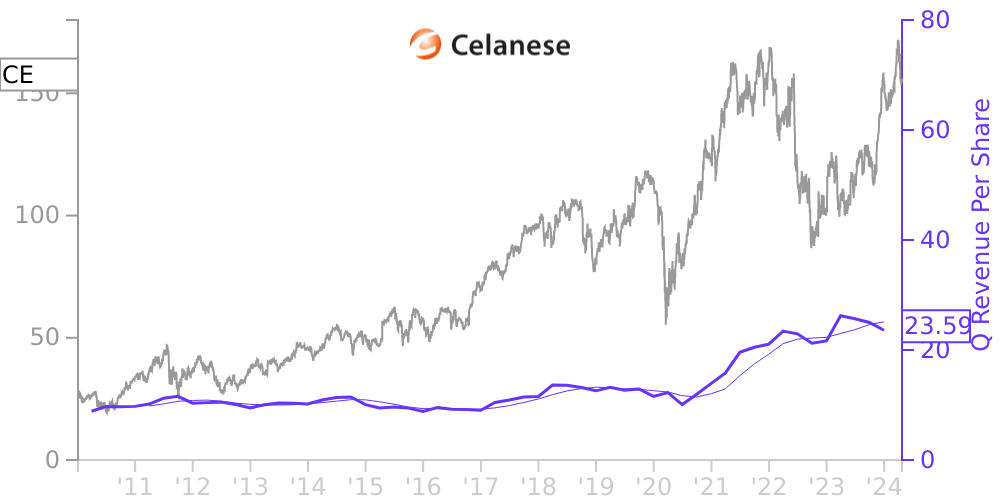
CE Stock Price Correlated With Celanese Financials
External Links ⌄
Income Statement
Cash Flow
Balance Sheet
CE Income Statement
Enable JavaScript and reload
Revenue, Net:
Cost of Goods & Services Sold:
Gross Profit:
Selling, General & Admin Expense:
Research & Development Expense:
Total Operating Expenses:
Operating Income:
Income Taxes:
Net Income:
CE Cash Flow
Enable JavaScript and reload
Operating Activities Net Income:
Depreciation, Depletion & Amortization:
Change in Accounts Receiveable:
Net Cash from Operations:
Repurchases/Buybacks Common Stock:
Issuance of Long-term Debt:
Cash Dividends Paid:
Net Cash from Financing Activities:
Property, Plant & Equipment Purchases:
Purchases of Businesses, Net of Cash:
Net Cash from Investing Activities:
Net Change in Cash & Equivalents:
CE Balance Sheet
Enable JavaScript and reload
Cash and Cash Equivalents:
Short-Term Investments:
Accounts Receivable, Net:
Inventories:
Total Current Assets:
Property, Plant & Equipment, Net:
Total Assets:
Accounts Payable:
Current Portion of Long-Term Debt:
Total Short-Term Liabilities:
Long Term Debt, Non-Current Portion:
Total Long-Term Liabilities:
Total Liabilities:
COMPANY PROFILE
Celanese Corporation and its subsidiaries is a global chemical and specialty materials company. The Company produces high performance engineered polymers that are used in a variety of high-value applications, as well as acetyl products, which are intermediate chemicals for nearly all major industries. The Company also engineers and manufactures a wide variety of products essential to everyday living. The Company's broad product portfolio serves a diverse set of end-use applications including automotive, chemical additives, construction, consumer and industrial adhesives, consumer and medical, energy storage, filtration, food and beverage, paints and coatings, paper and packaging, performance industrial and textiles.
Free historical financial statements for Celanese Corp.. See how revenue, income, cash flow, and balance sheet financials have changed over 65 quarters since 2010. Compare with CE stock chart to see long term trends.
Data imported from Celanese Corp. SEC filings. Check original filings before making any investment decision.