Materials › Agriculture Chemicals

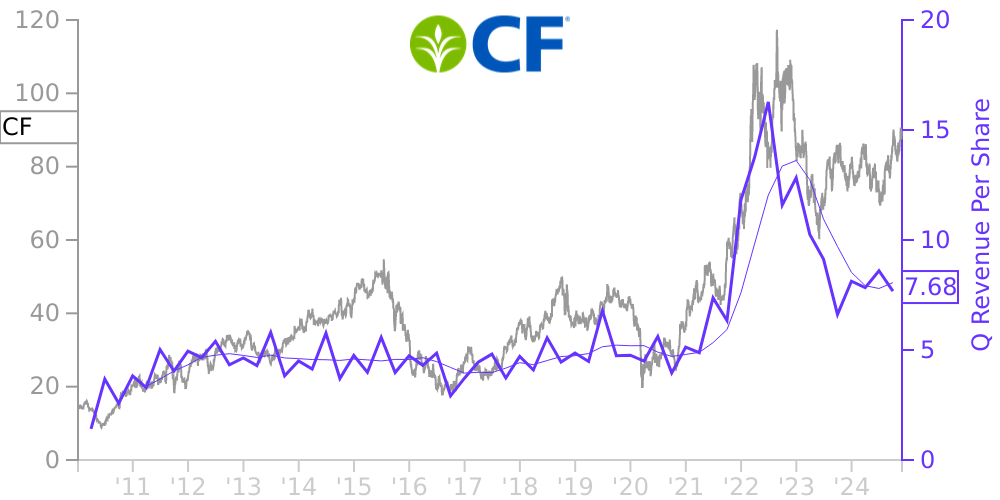
CF Stock Price Correlated With CF Industries Holdings Financials
External Links ⌄
Income Statement
Cash Flow
Balance Sheet
CF Income Statement
Enable JavaScript and reload
Revenue, Net:
Cost of Goods & Services Sold:
Gross Profit:
Selling, General & Admin Expense:
Research & Development Expense:
Total Operating Expenses:
Operating Income:
Income Taxes:
Net Income:
CF Cash Flow
Enable JavaScript and reload
Operating Activities Net Income:
Depreciation, Depletion & Amortization:
Change in Accounts Receiveable:
Net Cash from Operations:
Repurchases/Buybacks Common Stock:
Issuance of Long-term Debt:
Cash Dividends Paid:
Net Cash from Financing Activities:
Property, Plant & Equipment Purchases:
Purchases of Businesses, Net of Cash:
Net Cash from Investing Activities:
Net Change in Cash & Equivalents:
CF Balance Sheet
Enable JavaScript and reload
Cash and Cash Equivalents:
Short-Term Investments:
Accounts Receivable, Net:
Inventories:
Total Current Assets:
Property, Plant & Equipment, Net:
Total Assets:
Accounts Payable:
Current Portion of Long-Term Debt:
Total Short-Term Liabilities:
Long Term Debt, Non-Current Portion:
Total Long-Term Liabilities:
Total Liabilities:
COMPANY PROFILE
Background and Basis of Presentation Our mission is to provide clean energy to feed and fuel the world sustainably. With our employees focused on safe and reliable operations, environmental stewardship, and disciplined capital and corporate management, we are on a path to decarbonize our ammonia production network – the world’s largest – to enable green and blue hydrogen and nitrogen products for energy, fertilizer, emissions abatement and other industrial activities. Our nine nitrogen manufacturing complexes in the United States, Canada and the United Kingdom, an extensive storage, transportation and distribution network in North America, and logistics capabilities enabling a global reach underpin our strategy to leverage our unique capabilities to accelerate the world’s transition to clean energy. Our principal customers are cooperatives, independent fertilizer distributors, traders, wholesalers and industrial users. Our core product is anhydrous ammonia (ammonia), which contains 82% nitrogen and 18% hydrogen. Our nitrogen products that are upgraded from ammonia are granular urea, urea ammonium nitrate solution (UAN) and ammonium nitrate (AN). Our other nitrogen products include diesel exhaust fluid (DEF), urea liquor, nitric acid and aqua ammonia, which are sold primarily to our industrial customers, and compound fertilizer products (NPKs), which are solid granular fertilizer products for which the nutrient content is a combination of nitrogen, phosphorus and potassium.
All references to “CF Holdings,” “the Company,” “we,” “us” and “our” refer to CF Industries Holdings, Inc. and its subsidiaries, except where the context makes clear that the reference is only to CF Industries Holdings, Inc. itself and not its subsidiaries. All references to “CF Industries” refer to CF Industries, Inc., a 100% owned subsidiary of CF Industries Holdings, Inc.
Our principal assets as of December 31, 2021 include:
• five U.S. nitrogen manufacturing facilities, located in Donaldsonville, Louisiana; Port Neal, Iowa; Yazoo City, Mississippi; Verdigris, Oklahoma; and Woodward, Oklahoma. These facilities are wholly owned directly or indirectly by CF Industries Nitrogen, LLC (CFN), of which we own approximately 89% and CHS Inc. (CHS) owns the remainder. See Note 18—Noncontrolling Interest for additional information on our strategic venture with CHS;
• two Canadian nitrogen manufacturing facilities, located in Medicine Hat, Alberta and Courtright, Ontario;
• two United Kingdom nitrogen manufacturing facilities, located in Billingham and Ince;
• an extensive system of terminals and associated transportation equipment located primarily in the Midwestern United States; and
• a 50% interest in Point Lisas Nitrogen Limited (PLNL), an ammonia production joint venture located in the Republic of Trinidad and Tobago that we account for under the equity method.
Free historical financial statements for CF Industries Holdings Inc.. See how revenue, income, cash flow, and balance sheet financials have changed over 65 quarters since 2010. Compare with CF stock chart to see long term trends.
Data imported from CF Industries Holdings Inc. SEC filings. Check original filings before making any investment decision.