
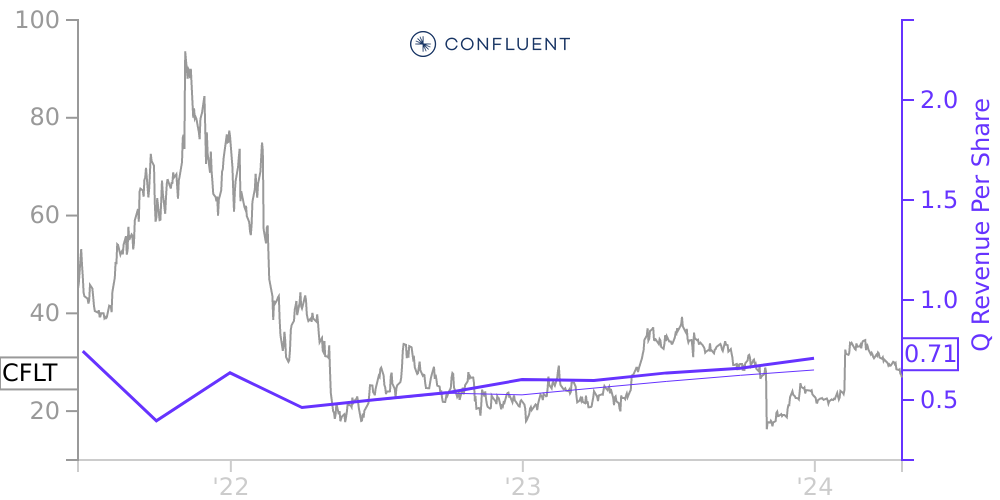
CFLT Stock Price Correlated With Confluent Financials
External Links ⌄
Income Statement
Cash Flow
Balance Sheet
CFLT Income Statement
Enable JavaScript and reload
Revenue, Net:
Cost of Goods & Services Sold:
Gross Profit:
Selling, General & Admin Expense:
Research & Development Expense:
Total Operating Expenses:
Operating Income:
Income Taxes:
Net Income:
CFLT Cash Flow
Enable JavaScript and reload
Operating Activities Net Income:
Depreciation, Depletion & Amortization:
Change in Accounts Receiveable:
Net Cash from Operations:
Repurchases/Buybacks Common Stock:
Issuance of Long-term Debt:
Cash Dividends Paid:
Net Cash from Financing Activities:
Property, Plant & Equipment Purchases:
Purchases of Businesses, Net of Cash:
Net Cash from Investing Activities:
Net Change in Cash & Equivalents:
CFLT Balance Sheet
Enable JavaScript and reload
Cash and Cash Equivalents:
Short-Term Investments:
Accounts Receivable, Net:
Inventories:
Total Current Assets:
Property, Plant & Equipment, Net:
Total Assets:
Accounts Payable:
Current Portion of Long-Term Debt:
Total Short-Term Liabilities:
Long Term Debt, Non-Current Portion:
Total Long-Term Liabilities:
Total Liabilities:
COMPANY PROFILE
1. Organization and Description of Business Description of Business Confluent , Inc. (“Confluent” or the “Company”) created a data infrastructure platform focused on data in motion. Confluent’s platform allows customers to connect their applications, systems, and data layers and can be deployed either as a self-managed software offering, Confluent Platform, or as a fully-managed cloud-native software-as-a-service (“SaaS”) offering, Confluent Cloud. Confluent also offers professional services and education services. The Company was incorporated in the state of Delaware in September 2014 and is headquartered in California with various other global office locations.
Free historical financial statements for Confluent Inc.. See how revenue, income, cash flow, and balance sheet financials have changed over 19 quarters since 2021. Compare with CFLT stock chart to see long term trends.
Data imported from Confluent Inc. SEC filings. Check original filings before making any investment decision.