Real Estate › Operative Builders

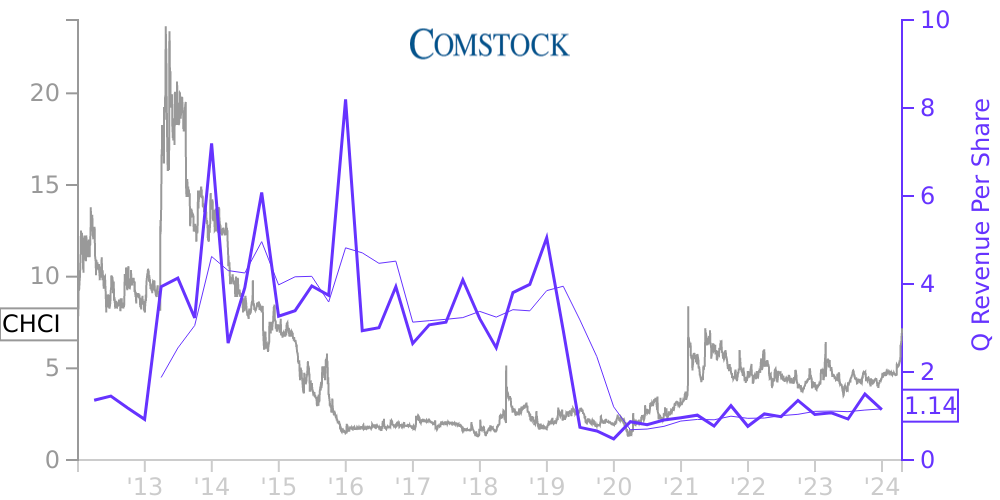
CHCI Stock Price Correlated With Comstock Holding Cos. Financials
External Links ⌄
Income Statement
Cash Flow
Balance Sheet
CHCI Income Statement
Enable JavaScript and reload
Revenue, Net:
Cost of Goods & Services Sold:
Gross Profit:
Selling, General & Admin Expense:
Research & Development Expense:
Total Operating Expenses:
Operating Income:
Income Taxes:
Net Income:
CHCI Cash Flow
Enable JavaScript and reload
Operating Activities Net Income:
Depreciation, Depletion & Amortization:
Change in Accounts Receiveable:
Net Cash from Operations:
Repurchases/Buybacks Common Stock:
Issuance of Long-term Debt:
Cash Dividends Paid:
Net Cash from Financing Activities:
Property, Plant & Equipment Purchases:
Purchases of Businesses, Net of Cash:
Net Cash from Investing Activities:
Net Change in Cash & Equivalents:
CHCI Balance Sheet
Enable JavaScript and reload
Cash and Cash Equivalents:
Short-Term Investments:
Accounts Receivable, Net:
Inventories:
Total Current Assets:
Property, Plant & Equipment, Net:
Total Assets:
Accounts Payable:
Current Portion of Long-Term Debt:
Total Short-Term Liabilities:
Long Term Debt, Non-Current Portion:
Total Long-Term Liabilities:
Total Liabilities:
COMPANY PROFILE
Company Overview Comstock Holding Companies, Inc. ("Comstock" or the "Company") was incorporated in the state of Delaware in 2004 and is a leading developer and manager of mixed-use and transit-oriented properties with operations that are primarily focused in the Washington, D.C. metropolitan area.
In February 2021, the Company amended the entity names for the five real estate-focused subsidiaries through which it primarily operates as part of operational efficiency enhancements. The entity names were changed as follows:
• CDS Asset Management, LC is now CHCI Asset Management, LC
• Comstock Commercial Management, LC is now CHCI Commercial Management, LC
• Comstock Residential Management, LC is now CHCI Residential Management, LC, and
• CDS Capital Management, L.C. is now CHCI Capital Management, LC.
On June 16, 2021, the Company made the strategic decision to pursue the sale of the operations of Comstock Environmental Services, LLC ("CES"), a subsidiary of Comstock, based on the continued growth and future prospects of the asset management business. Accordingly, the Company has reflected CES as a discontinued operation in its consolidated statements of operations for all periods presented, and have also designated CES assets and liabilities as held for sale in its consolidated balance sheets. Unless otherwise noted, all amounts and disclosures relate to the Company's continuing operations. For additional information, see Note 3.
Free historical financial statements for Comstock Holding Cos. Inc.. See how revenue, income, cash flow, and balance sheet financials have changed over 57 quarters since 2012. Compare with CHCI stock chart to see long term trends.
Data imported from Comstock Holding Cos. Inc. SEC filings. Check original filings before making any investment decision.