Technology › Telephone And Telegraph Apparatus

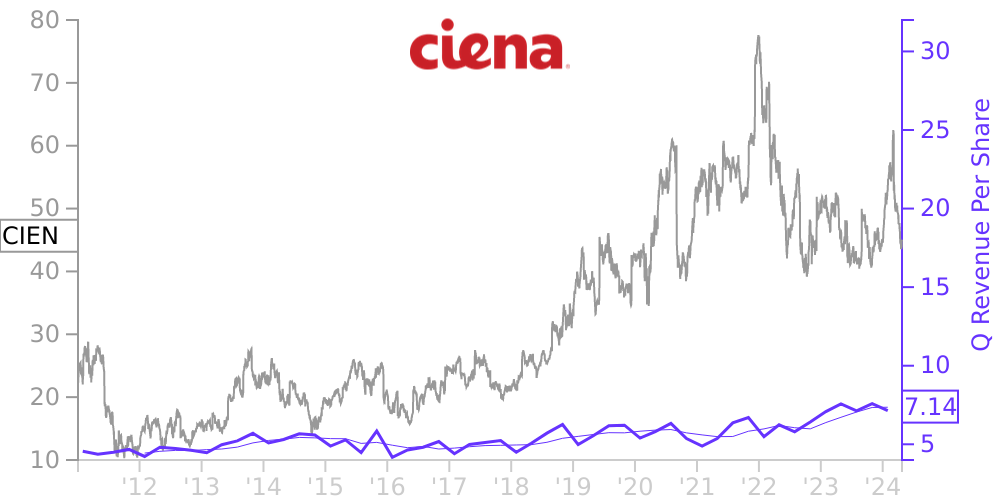
CIEN Stock Price Correlated With Ciena Financials
External Links ⌄
Income Statement
Cash Flow
Balance Sheet
CIEN Income Statement
Enable JavaScript and reload
Revenue, Net:
Cost of Goods & Services Sold:
Gross Profit:
Selling, General & Admin Expense:
Research & Development Expense:
Total Operating Expenses:
Operating Income:
Income Taxes:
Net Income:
CIEN Cash Flow
Enable JavaScript and reload
Operating Activities Net Income:
Depreciation, Depletion & Amortization:
Change in Accounts Receiveable:
Net Cash from Operations:
Repurchases/Buybacks Common Stock:
Issuance of Long-term Debt:
Cash Dividends Paid:
Net Cash from Financing Activities:
Property, Plant & Equipment Purchases:
Purchases of Businesses, Net of Cash:
Net Cash from Investing Activities:
Net Change in Cash & Equivalents:
CIEN Balance Sheet
Enable JavaScript and reload
Cash and Cash Equivalents:
Short-Term Investments:
Accounts Receivable, Net:
Inventories:
Total Current Assets:
Property, Plant & Equipment, Net:
Total Assets:
Accounts Payable:
Current Portion of Long-Term Debt:
Total Short-Term Liabilities:
Long Term Debt, Non-Current Portion:
Total Long-Term Liabilities:
Total Liabilities:
COMPANY PROFILE
CIENA CORPORATION AND SIGNIFICANT ACCOUNTING POLICIES AND ESTIMATES Description of Business
Ciena Corporation (“Ciena” or the “Company”) is a networking systems, services and software company, providing solutions that enable a wide range of network operators to deploy and manage next-generation networks that deliver services to businesses and consumers. Ciena provides hardware, software and services that enable the transport, routing, switching, aggregation, service delivery and management of video, data and voice traffic on communications networks. Ciena’s solutions are used by communications service providers, cable and multiservice operators, Web-scale providers, submarine network operators, governments, enterprises, research and education institutions and emerging network operators.
Ciena’s portfolio is designed to enable what Ciena refers to as the Adaptive Network TM , Ciena’s vision for a network end state that emphasizes a programmable and scalable network infrastructure, software control and automation capabilities, network analytics and intelligence, and related advanced services. By transforming network infrastructures into a dynamic, programmable environment driven by automation and analytics, network operators can realize greater business agility, dynamically adapt to changing end user service demands and rapidly introduce new revenue-generating services. They can also gain valuable real-time network insights, allowing them to optimize network operation and maximize the return on their network infrastructure investment.
Ciena’s solutions include Networking Platforms, including Ciena’s Converged Packet Optical and Routing and Switching portfolios, which can be applied from the network core to end-user access points, and which allow network operators to scale capacity, increase transmission speeds, allocate traffic efficiently and adapt dynamically to changing end-user service demands. Ciena’s Converged Packet Optical portfolio includes products that support the connection of content to content, including in long haul and regional, submarine and data center interconnect networks, and users to content, including in metro and edge networks. Ciena’s Routing and Switching portfolio includes products and solutions that enable efficient internet protocol (“IP”) transport in next-generation metro, edge, access and aggregation networks, connecting users to content in applications that include 5G and Internet of Things (“IoT”), mobile backhaul, optical access, virtualization and enterprise services.
To complement Networking Platforms, Ciena offers Platform Software, which includes a wide array of software solutions that deliver operations, administration, maintenance, and provisioning (“OAM&P”) functionality, as well as domain control, orchestration, operational support systems (“OSS”) and service assurance to achieve closed loop automation across multi-vendor and multi-domain network environments. Through Ciena’s Blue Planet® Software suite, Ciena enables customers to accelerate the digital transformation of their networks through service lifecycle automation.
In addition to Ciena’s systems and software, Ciena also offers a broad range of services that help its customers build, operate and improve their networks and associated operational environments. These include network transformation, consulting, implementation, systems integration, maintenance, network operations center (“NOC”) management, and optimization services.
Basis of Presentation
The accompanying consolidated financial statements include the accounts of Ciena and its wholly owned subsidiaries. All intercompany accounts and transactions have been eliminated in consolidation.
Ciena has a 52 or 53-week fiscal year, which ends on the Saturday nearest to the last day of October in each year (October 30, 2021, October 31, 2020 and November 2, 2019 for the periods reported). Fiscal 2021, fiscal 2020 and fiscal 2019 each consisted of a 52-week fiscal year.
Bu
Free historical financial statements for Ciena Corp. See how revenue, income, cash flow, and balance sheet financials have changed over 62 quarters since 2011. Compare with CIEN stock chart to see long term trends.
Data imported from Ciena Corp SEC filings. Check original filings before making any investment decision.