Energy › Oil, Gas Field Services, Nbc

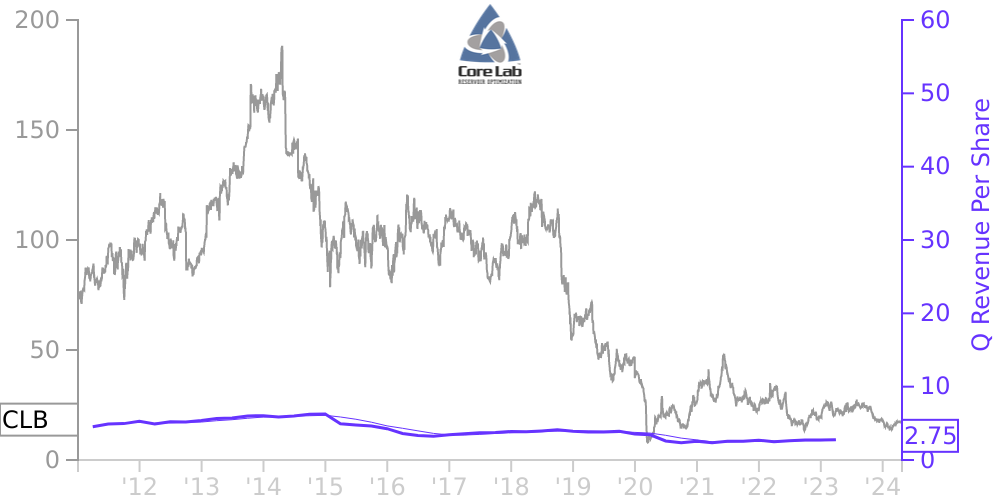
CLB Stock Price Correlated With Core Laboratories NV Financials
External Links ⌄
Income Statement
Cash Flow
Balance Sheet
CLB Income Statement
Enable JavaScript and reload
Revenue, Net:
Cost of Goods & Services Sold:
Gross Profit:
Selling, General & Admin Expense:
Research & Development Expense:
Total Operating Expenses:
Operating Income:
Income Taxes:
Net Income:
CLB Cash Flow
Enable JavaScript and reload
Operating Activities Net Income:
Depreciation, Depletion & Amortization:
Change in Accounts Receiveable:
Net Cash from Operations:
Repurchases/Buybacks Common Stock:
Issuance of Long-term Debt:
Cash Dividends Paid:
Net Cash from Financing Activities:
Property, Plant & Equipment Purchases:
Purchases of Businesses, Net of Cash:
Net Cash from Investing Activities:
Net Change in Cash & Equivalents:
CLB Balance Sheet
Enable JavaScript and reload
Cash and Cash Equivalents:
Short-Term Investments:
Accounts Receivable, Net:
Inventories:
Total Current Assets:
Property, Plant & Equipment, Net:
Total Assets:
Accounts Payable:
Current Portion of Long-Term Debt:
Total Short-Term Liabilities:
Long Term Debt, Non-Current Portion:
Total Long-Term Liabilities:
Total Liabilities:
COMPANY PROFILE
1. BASIS OF PRESENTATION The accompanying unaudited interim consolidated financial statements include the accounts of Core Laboratories N.V. and its subsidiaries for which we have a controlling voting interest and/or a controlling financial interest. These financial statements have been prepared in accordance with United States generally accepted accounting principles ("U.S. GAAP") for interim financial information using the instructions to Form 10-Q and Article 10 of Regulation S-X. Core Laboratories N.V.'s balance sheet information for the year ended December 31, 2021 was derived from the 2021 audited consolidated financial statements. Accordingly, these financial statements do not include all of the information and footnote disclosures required by U.S. GAAP for the annual financial statements, and should be read in conjunction with the audited financial statements and the summary of significant accounting policies and notes thereto included in our Annual Report on Form 10-K for the year ended December 31, 2021 (the "2021 Annual Report"). Core Laboratories N.V. uses the equity method of accounting for investments in which it has less than a majority interest and does not exercise control but does exert significant influence. Non-controlling interests have been recorded to reflect outside ownership attributable to consolidated subsidiaries that are less than 100 % owned. All inter-company transactions and balances have been eliminated in consolidation. In the opinion of management, all adjustments considered necessary for a fair statement of the results for the interim periods presented have been included in these financial statements. Furthermore, the operating results presented for the three months ended March 31, 2022 may not necessarily be indicative of the results that may be expected for the year ending December 31, 2022. References to “Core Lab”, "Core Laboratories", the "Company", "we", "our" and similar phrases are used throughout this Quarterly Report on Form 10-Q and relate collectively to Core Laboratories N.V. and its consolidated subsidiaries. We operate our business in two reportable segments: (1) Reservoir Description and (2) Production Enhancement. These complementary segments provide different services and products and utilize different technologies for evaluating and improving reservoir performance and increasing oil and gas recovery from new and existing fields. For a description of product types and services offered by these business segments, see Note 16, S egment Reporting . Certain reclassifications were made to prior period amounts in order to conform to the current period presentation. These reclassifications had no impact on the reported net income or cash flows for the three months ended March 31, 2021 .
Free historical financial statements for Core Laboratories NV. See how revenue, income, cash flow, and balance sheet financials have changed over 49 quarters since 2011. Compare with CLB stock chart to see long term trends.
Data imported from Core Laboratories NV SEC filings. Check original filings before making any investment decision.