Industrials › Hazardous Waste Management

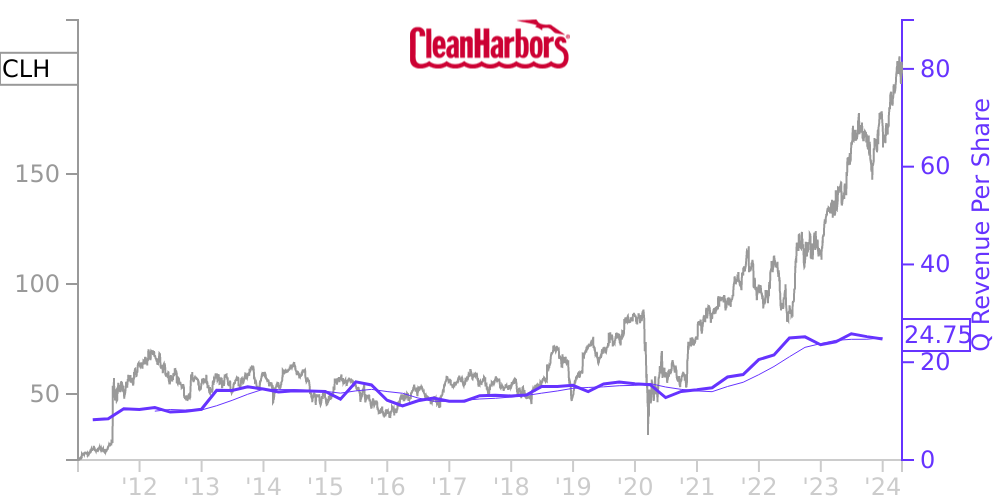
CLH Stock Price Correlated With Clean Harbors Financials
External Links ⌄
Income Statement
Cash Flow
Balance Sheet
CLH Income Statement
Enable JavaScript and reload
Revenue, Net:
Cost of Goods & Services Sold:
Gross Profit:
Selling, General & Admin Expense:
Research & Development Expense:
Total Operating Expenses:
Operating Income:
Income Taxes:
Net Income:
CLH Cash Flow
Enable JavaScript and reload
Operating Activities Net Income:
Depreciation, Depletion & Amortization:
Change in Accounts Receiveable:
Net Cash from Operations:
Repurchases/Buybacks Common Stock:
Issuance of Long-term Debt:
Cash Dividends Paid:
Net Cash from Financing Activities:
Property, Plant & Equipment Purchases:
Purchases of Businesses, Net of Cash:
Net Cash from Investing Activities:
Net Change in Cash & Equivalents:
CLH Balance Sheet
Enable JavaScript and reload
Cash and Cash Equivalents:
Short-Term Investments:
Accounts Receivable, Net:
Inventories:
Total Current Assets:
Property, Plant & Equipment, Net:
Total Assets:
Accounts Payable:
Current Portion of Long-Term Debt:
Total Short-Term Liabilities:
Long Term Debt, Non-Current Portion:
Total Long-Term Liabilities:
Total Liabilities:
COMPANY PROFILE
OPERATIONSClean Harbors, Inc., through its subsidiaries (collectively, the "Company"), is a leading provider of environmental and industrial services throughout North America. The Company is also the largest re-refiner and recycler of used oil and the premier provider of parts cleaning and related environmental services to commercial, industrial and automotive customers in North America.
Free historical financial statements for Clean Harbors Inc. See how revenue, income, cash flow, and balance sheet financials have changed over 61 quarters since 2011. Compare with CLH stock chart to see long term trends.
Data imported from Clean Harbors Inc SEC filings. Check original filings before making any investment decision.