Materials › Steel Works, Blast Furnaces Rolling Mills (Coke Ovens)

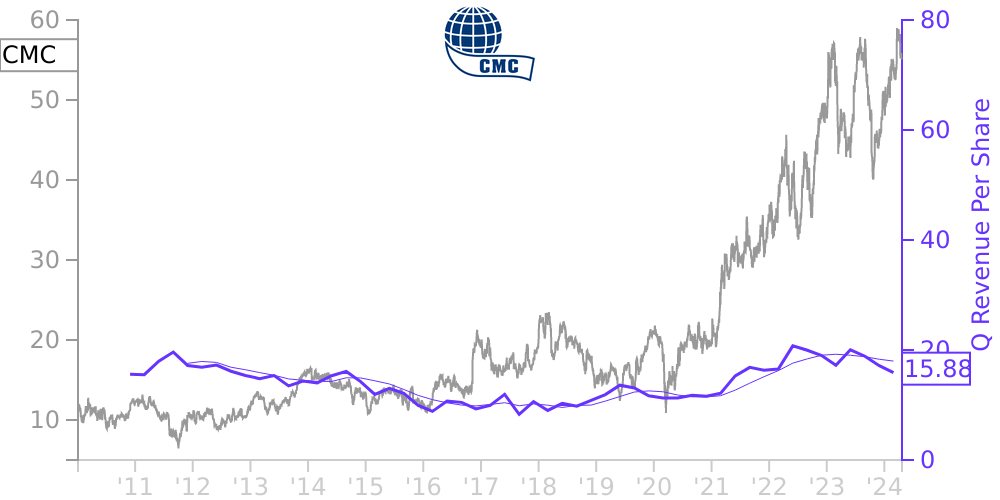
CMC Stock Price Correlated With Commercial Metals Co Financials
External Links ⌄
Income Statement
Cash Flow
Balance Sheet
CMC Income Statement
Enable JavaScript and reload
Revenue, Net:
Cost of Goods & Services Sold:
Gross Profit:
Selling, General & Admin Expense:
Research & Development Expense:
Total Operating Expenses:
Operating Income:
Income Taxes:
Net Income:
CMC Cash Flow
Enable JavaScript and reload
Operating Activities Net Income:
Depreciation, Depletion & Amortization:
Change in Accounts Receiveable:
Net Cash from Operations:
Repurchases/Buybacks Common Stock:
Issuance of Long-term Debt:
Cash Dividends Paid:
Net Cash from Financing Activities:
Property, Plant & Equipment Purchases:
Purchases of Businesses, Net of Cash:
Net Cash from Investing Activities:
Net Change in Cash & Equivalents:
CMC Balance Sheet
Enable JavaScript and reload
Cash and Cash Equivalents:
Short-Term Investments:
Accounts Receivable, Net:
Inventories:
Total Current Assets:
Property, Plant & Equipment, Net:
Total Assets:
Accounts Payable:
Current Portion of Long-Term Debt:
Total Short-Term Liabilities:
Long Term Debt, Non-Current Portion:
Total Long-Term Liabilities:
Total Liabilities:
COMPANY PROFILE
NOTE 1 — QUARTERLY FINANCIAL DATA
The accompanying unaudited consolidated financial statements have been prepared in accordance with
accounting principles generally accepted in the United States on a basis consistent with that used
in the Company’s Annual Report on Form 10-K filed with the Securities and Exchange Commission
(“SEC”) for the year ended August 31, 2010, and include all normal recurring adjustments necessary
to present fairly the consolidated balance sheets and statements of operations, cash flows and
stockholders’ equity for the periods indicated. These notes should be read in conjunction with such
Form 10-K. The results of operations for the three month period are not necessarily indicative of
the results to be expected for a full year.
Free historical financial statements for Commercial Metals Co.. See how revenue, income, cash flow, and balance sheet financials have changed over 63 quarters since 2010. Compare with CMC stock chart to see long term trends.
Data imported from Commercial Metals Co. SEC filings. Check original filings before making any investment decision.