Industrials › Construction Machinery And Equip

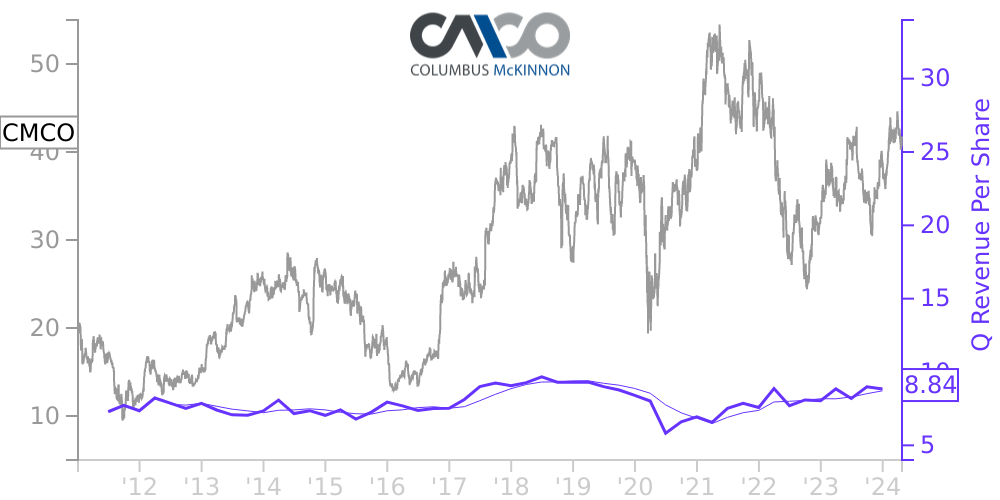
CMCO Stock Price Correlated With Columbus McKinnon Financials
External Links ⌄
Income Statement
Cash Flow
Balance Sheet
CMCO Income Statement
Enable JavaScript and reload
Revenue, Net:
Cost of Goods & Services Sold:
Gross Profit:
Selling, General & Admin Expense:
Research & Development Expense:
Total Operating Expenses:
Operating Income:
Income Taxes:
Net Income:
CMCO Cash Flow
Enable JavaScript and reload
Operating Activities Net Income:
Depreciation, Depletion & Amortization:
Change in Accounts Receiveable:
Net Cash from Operations:
Repurchases/Buybacks Common Stock:
Issuance of Long-term Debt:
Cash Dividends Paid:
Net Cash from Financing Activities:
Property, Plant & Equipment Purchases:
Purchases of Businesses, Net of Cash:
Net Cash from Investing Activities:
Net Change in Cash & Equivalents:
CMCO Balance Sheet
Enable JavaScript and reload
Cash and Cash Equivalents:
Short-Term Investments:
Accounts Receivable, Net:
Inventories:
Total Current Assets:
Property, Plant & Equipment, Net:
Total Assets:
Accounts Payable:
Current Portion of Long-Term Debt:
Total Short-Term Liabilities:
Long Term Debt, Non-Current Portion:
Total Long-Term Liabilities:
Total Liabilities:
COMPANY PROFILE
Description of Business
Columbus McKinnon Corporation ("the Company") is a leading worldwide designer, manufacturer, and marketer of hoists, actuators, rigging tools, digital power control systems, motion control products, and other technologies, systems, and services that efficiently and ergonomically move, lift, position, and secure materials. Key products include hoists, rigging tools, digital power control systems, actuators, elevator application drive systems, and explosion-protected hoists. The Company is focused on commercial and industrial applications that require safety and productivity in moving material. The Company’s targeted market verticals include general industrial, construction and infrastructure, mining, oil & gas, energy, aerospace, transportation, automotive, heavy equipment manufacturing, and entertainment.
The Company’s material handling products are sold globally, principally to third party distributors through diverse distribution channels and, to a lesser extent, directly to end-users. During fiscal 2021, approximately 53% of sales were to customers in the United States
Free historical financial statements for Columbus McKinnon Corp.. See how revenue, income, cash flow, and balance sheet financials have changed over 60 quarters since 2011. Compare with CMCO stock chart to see long term trends.
Data imported from Columbus McKinnon Corp. SEC filings. Check original filings before making any investment decision.