Real Estate › Real Estate Investment Trusts

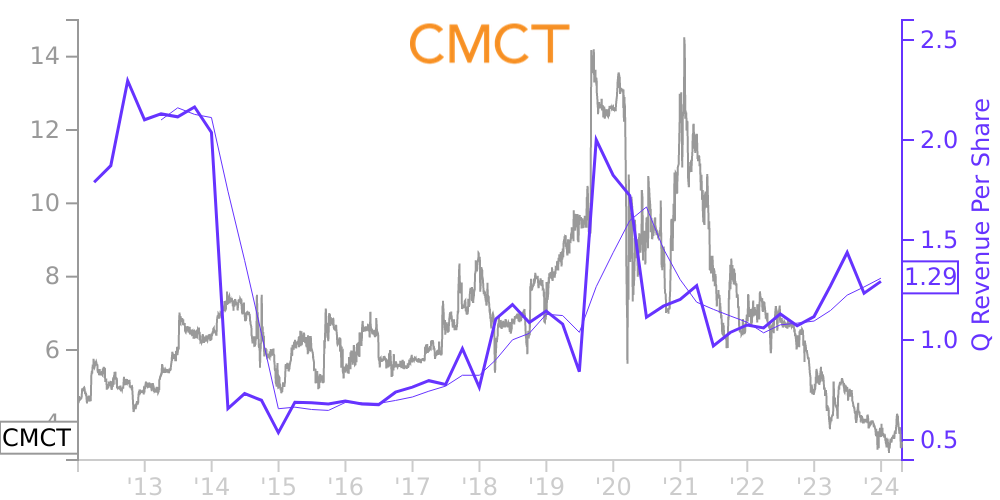
CMCT Stock Price Correlated With CIM Commercial Trust Financials
External Links ⌄
Income Statement
Cash Flow
Balance Sheet
CMCT Income Statement
Enable JavaScript and reload
Revenue, Net:
Cost of Goods & Services Sold:
Gross Profit:
Selling, General & Admin Expense:
Research & Development Expense:
Total Operating Expenses:
Operating Income:
Income Taxes:
Net Income:
CMCT Cash Flow
Enable JavaScript and reload
Operating Activities Net Income:
Depreciation, Depletion & Amortization:
Change in Accounts Receiveable:
Net Cash from Operations:
Repurchases/Buybacks Common Stock:
Issuance of Long-term Debt:
Cash Dividends Paid:
Net Cash from Financing Activities:
Property, Plant & Equipment Purchases:
Purchases of Businesses, Net of Cash:
Net Cash from Investing Activities:
Net Change in Cash & Equivalents:
CMCT Balance Sheet
Enable JavaScript and reload
Cash and Cash Equivalents:
Short-Term Investments:
Accounts Receivable, Net:
Inventories:
Total Current Assets:
Property, Plant & Equipment, Net:
Total Assets:
Accounts Payable:
Current Portion of Long-Term Debt:
Total Short-Term Liabilities:
Long Term Debt, Non-Current Portion:
Total Long-Term Liabilities:
Total Liabilities:
COMPANY PROFILE
Note 1. Basis of Presentation:
The accompanying interim financial statements of PMC Commercial Trust (“PMC Commercial” or together with its wholly-owned
subsidiaries, “we,” “us” or “our”) have not been audited by independent accountants. These consolidated financial statements have been prepared in accordance with accounting principles generally accepted in the United
States (“U.S. GAAP”) for interim financial information and with the instructions to Form 10-Q. Accordingly, they do not include all of the information and footnotes required by U.S. GAAP for complete financial statement presentation. In
the opinion of management, the financial statements include all normal recurring adjustments necessary for a fair statement of the results for the interim period. All material intercompany balances and transactions have been eliminated. The results
for the three months ended March 31, 2012 are not necessarily indicative of future financial results. Therefore, these financial statements should be read in conjunction with the financial statements and notes thereto included in our Annual
Report on Form 10-K for the year ended December 31, 2011.
The preparation of financial statements in conformity with generally accepted
accounting principles requires management to make estimates and assumptions that affect (1) the reported amounts of assets and liabilities and disclosure of contingent assets and liabilities at the date of the financial statements and
(2) the reported amounts of revenues and expenses during the period. Actual results could differ from those estimates. Our most sensitive estimates involve the valuation of our real estate owned and determination of loan loss reserves.
Free historical financial statements for CIM Commercial Trust Corp.. See how revenue, income, cash flow, and balance sheet financials have changed over 52 quarters since 2012. Compare with CMCT stock chart to see long term trends.
Data imported from CIM Commercial Trust Corp. SEC filings. Check original filings before making any investment decision.