Consumer Discretionary › Retail-Eating Places

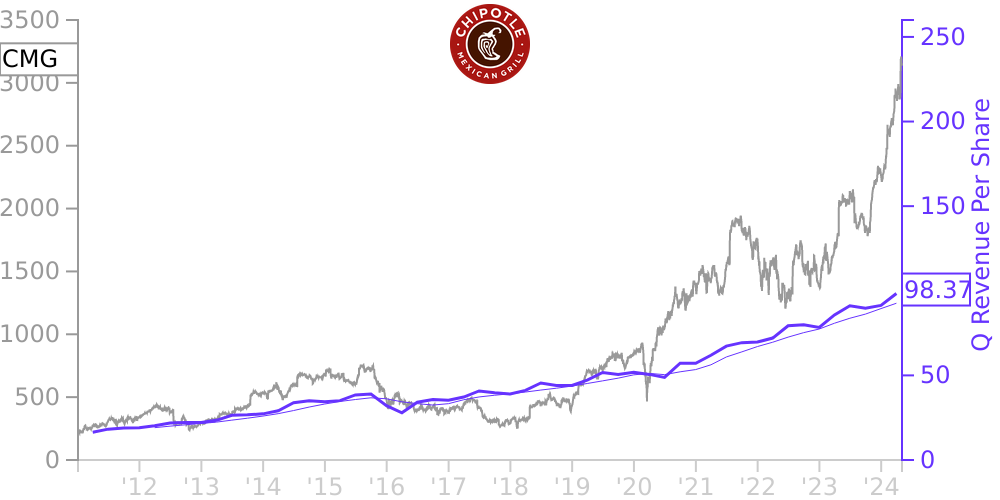
CMG Stock Price Correlated With Chipotle Mexican Grill Financials
External Links ⌄
Income Statement
Cash Flow
Balance Sheet
CMG Income Statement
Enable JavaScript and reload
Revenue, Net:
Cost of Goods & Services Sold:
Gross Profit:
Selling, General & Admin Expense:
Research & Development Expense:
Total Operating Expenses:
Operating Income:
Income Taxes:
Net Income:
CMG Cash Flow
Enable JavaScript and reload
Operating Activities Net Income:
Depreciation, Depletion & Amortization:
Change in Accounts Receiveable:
Net Cash from Operations:
Repurchases/Buybacks Common Stock:
Issuance of Long-term Debt:
Cash Dividends Paid:
Net Cash from Financing Activities:
Property, Plant & Equipment Purchases:
Purchases of Businesses, Net of Cash:
Net Cash from Investing Activities:
Net Change in Cash & Equivalents:
CMG Balance Sheet
Enable JavaScript and reload
Cash and Cash Equivalents:
Short-Term Investments:
Accounts Receivable, Net:
Inventories:
Total Current Assets:
Property, Plant & Equipment, Net:
Total Assets:
Accounts Payable:
Current Portion of Long-Term Debt:
Total Short-Term Liabilities:
Long Term Debt, Non-Current Portion:
Total Long-Term Liabilities:
Total Liabilities:
COMPANY PROFILE
1. Basis of Presentation and Update to Accounting Policies In this quarterly report on Form 10-Q, Chipotle Mexican Grill, Inc., a Delaware corporation, together with its subsidiaries, is collectively referred to as “Chipotle,” “we,” “us,” or “our.” We develop and operate restaurants that serve a relevant menu of burritos, burrito bowls, quesadillas, tacos, and salads, made using fresh, high-quality ingredients. As of March 31, 2022, we operated 3,014 restaurants including 2,964 Chipotle restaurants within the United States, 46 international Chipotle restaurants, and four Pizzeria Locale restaurants. Pizzeria Locale is a fast casual pizza concept that is owned and operated by a consolidated entity that we are an investor in. We manage our U.S. operations based on eight regions and have aggregated our operations to one reportable segment. Certain prior-year amounts have been reclassified to conform to the current year presentation. We have prepared the accompanying unaudited condensed consolidated financial statements in accordance with U.S. generally accepted accounting principles for interim financial statements and pursuant to the rules and regulations of the Securities and Exchange Commission. In the opinion of management, the accompanying unaudited condensed consolidated financial statements reflect all adjustments consisting of normal recurring adjustments necessary for a fair presentation of our financial position and results of operations. Interim results of operations are not necessarily indicative of the results that may be achieved for the full year. The financial statements and related notes do not include all information and footnotes required by U.S. generally accepted accounting principles for annual reports. This quarterly report should be read in conjunction with the consolidated financial statements included in our annual report on Form 10-K for the year ended December 31, 2021.
Free historical financial statements for Chipotle Mexican Grill Inc. See how revenue, income, cash flow, and balance sheet financials have changed over 61 quarters since 2011. Compare with CMG stock chart to see long term trends.
Data imported from Chipotle Mexican Grill Inc SEC filings. Check original filings before making any investment decision.