Industrials › Engines And Turbines

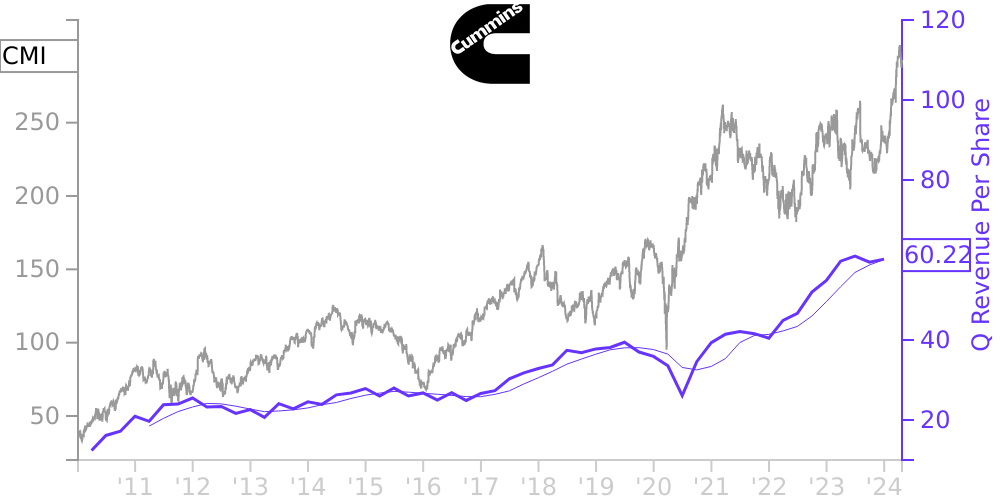
CMI Stock Price Correlated With Cummins Financials
External Links ⌄
Income Statement
Cash Flow
Balance Sheet
CMI Income Statement
Enable JavaScript and reload
Revenue, Net:
Cost of Goods & Services Sold:
Gross Profit:
Selling, General & Admin Expense:
Research & Development Expense:
Total Operating Expenses:
Operating Income:
Income Taxes:
Net Income:
CMI Cash Flow
Enable JavaScript and reload
Operating Activities Net Income:
Depreciation, Depletion & Amortization:
Change in Accounts Receiveable:
Net Cash from Operations:
Repurchases/Buybacks Common Stock:
Issuance of Long-term Debt:
Cash Dividends Paid:
Net Cash from Financing Activities:
Property, Plant & Equipment Purchases:
Purchases of Businesses, Net of Cash:
Net Cash from Investing Activities:
Net Change in Cash & Equivalents:
CMI Balance Sheet
Enable JavaScript and reload
Cash and Cash Equivalents:
Short-Term Investments:
Accounts Receivable, Net:
Inventories:
Total Current Assets:
Property, Plant & Equipment, Net:
Total Assets:
Accounts Payable:
Current Portion of Long-Term Debt:
Total Short-Term Liabilities:
Long Term Debt, Non-Current Portion:
Total Long-Term Liabilities:
Total Liabilities:
COMPANY PROFILE
NOTE 1. SUMMARY OF SIGNIFICANT ACCOUNTING POLICIES
Nature of Operations
We were founded in 1919 as Cummins Engine Company, a corporation in Columbus, Indiana and one of the first diesel engine manufacturers. In 2001, we changed our name to Cummins Inc. We are a global power leader that designs, manufactures, distributes and services diesel, natural gas, electric and hybrid powertrains and powertrain-related components including filtration, aftertreatment, turbochargers, fuel systems, controls systems, air handling systems, automated transmissions, electric power generation systems, batteries, electrified power systems, hydrogen production and fuel cell products. We sell our products to original equipment manufacturers (OEMs), distributors, dealers and other customers worldwide. We serve our customers through a service network of approximately 500 wholly-owned, joint venture and independent distributor locations and more than 10,000 Cummins certified dealer locations in approximately 190 countries and territories.
COVID-19
The outbreak of COVID-19 in early 2020 became a global pandemic with the resultant economic impacts evolving into a worldwide recession. The pandemic triggered a significant downturn in our markets globally, which negatively impacted our sales and results of operations during 2020. While the majority of the negative impacts to demand largely subsided in 2021, we are still experiencing supply chain disruptions and related financial impacts reflected as increased cost of sales. Our industry continues to be unfavorably impacted by supply chain constraints leading to shortages across multiple components categories and limiting our collective ability to meet end-user demand. Our customers are also experiencing other supply chain issues and slowing production.
Principles of Consolidation
Our Consolidated Financial Statements are prepared in accordance with generally accepted accounting principles in the United States of America (GAAP). All intercompany balances and transactions are eliminated in consolidation.
We include the accounts of all wholly-owned and majority-owned domestic and foreign subsidiaries where our ownership is more than 50 percent of outstanding equity interests except for majority-owned subsidiaries that are considered variable interest entities (VIEs) where we are not deemed to have a controlling financial interest. In addition, we also consolidate, regardless of our ownership percentage, VIEs or joint ventures for which we are deemed to have a controlling financial interest. We have variable interests in several businesses accounted for under the equity method of accounting, however most of these VIEs are unconsolidated.
For consolidated entities where our ownership interest is less than 100 percent, the noncontrolling ownership interests are reported in our Consolidated Balance Sheets . The noncontrolling ownership interest in our income, net of tax, is classified as "Net income attributable to noncontrolling interests" in our Consolidated Statements of Net Income .
Reclassifications
Certain amounts for 2020 and 2019 were reclassified to conform to the current year presentation.
Investments in Equity Investees
We use the equity method to account for our investments in joint ventures, affiliated companies and alliances in which we have the ability to exercise significant influence, generally represented by equity ownership or partnership equity of at least 20 percent but not more than 50 percent. Generally, under the equity method, original investments in these entities are recorded at cost and subsequently adjusted by our share of equity in income or losses after the date of acquisition. Investment amounts in excess of our share of an investee's net assets are amortized over the life of the related asset creating the excess, except goodwill which is not amortized. Equity in income or losses of each investee is recorded according to our level of ownership; if losses accumulate, we
Free historical financial statements for Cummins Inc. See how revenue, income, cash flow, and balance sheet financials have changed over 65 quarters since 2010. Compare with CMI stock chart to see long term trends.
Data imported from Cummins Inc SEC filings. Check original filings before making any investment decision.