Technology › Radio And Tv Broadcasting And Communications Equipment

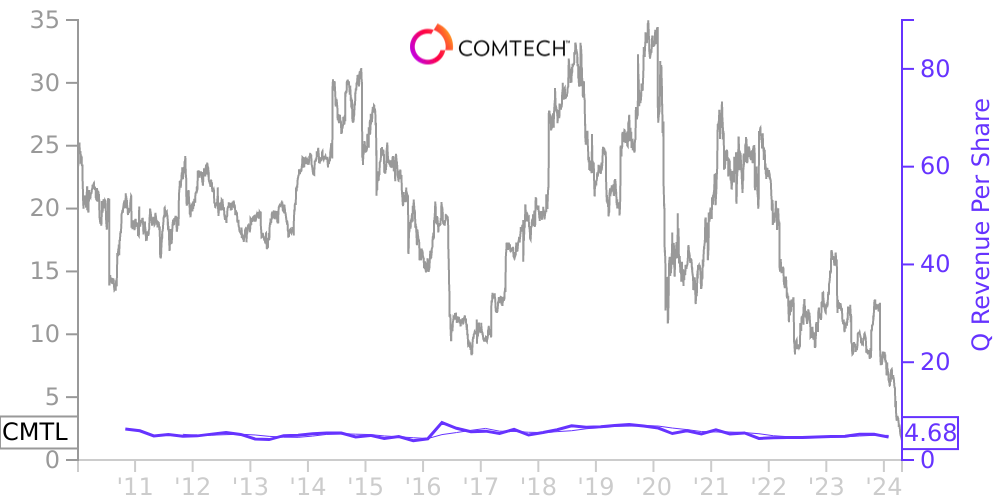
CMTL Stock Price Correlated With Comtech Telecommunications Financials
External Links ⌄
Income Statement
Cash Flow
Balance Sheet
CMTL Income Statement
Enable JavaScript and reload
Revenue, Net:
Cost of Goods & Services Sold:
Gross Profit:
Selling, General & Admin Expense:
Research & Development Expense:
Total Operating Expenses:
Operating Income:
Income Taxes:
Net Income:
CMTL Cash Flow
Enable JavaScript and reload
Operating Activities Net Income:
Depreciation, Depletion & Amortization:
Change in Accounts Receiveable:
Net Cash from Operations:
Repurchases/Buybacks Common Stock:
Issuance of Long-term Debt:
Cash Dividends Paid:
Net Cash from Financing Activities:
Property, Plant & Equipment Purchases:
Purchases of Businesses, Net of Cash:
Net Cash from Investing Activities:
Net Change in Cash & Equivalents:
CMTL Balance Sheet
Enable JavaScript and reload
Cash and Cash Equivalents:
Short-Term Investments:
Accounts Receivable, Net:
Inventories:
Total Current Assets:
Property, Plant & Equipment, Net:
Total Assets:
Accounts Payable:
Current Portion of Long-Term Debt:
Total Short-Term Liabilities:
Long Term Debt, Non-Current Portion:
Total Long-Term Liabilities:
Total Liabilities:
COMPANY PROFILE
General The accompanying condensed consolidated financial statements of Comtech Telecommunications Corp. and its subsidiaries ("Comtech," "we," "us," or "our") as of and for the three and nine months ended April 30, 2022 and 2021 are unaudited. In the opinion of management, the information furnished reflects all material adjustments (which include normal recurring adjustments) necessary for a fair presentation of the results for the unaudited interim periods. Our results of operations for such periods are not necessarily indicative of the results of operations to be expected for the full fiscal year.
The preparation of our condensed consolidated financial statements in conformity with accounting principles generally accepted in the United States of America requires us to make estimates and assumptions that affect the reported amount of assets and liabilities, and disclosure of contingent assets and liabilities, at the date of the condensed consolidated financial statements, and the reported amounts of net sales and expenses during the reported period. Actual results may differ from those estimates.
Our condensed consolidated financial statements should be read in conjunction with our audited consolidated financial statements, filed with the Securities and Exchange Commission ("SEC"), for the fiscal year ended July 31, 2021 and the notes thereto contained in our Annual Report on Form 10-K, and all of our other filings with the SEC.
Impact of Coronavirus Disease 2019 Pandemic ("COVID-19") and Global Supply Chain Constraints on Our Business
Since March 2020, we have conducted most of our non-production related operations using remote working arrangements, curtailed most business travel, and established social distancing safeguards. COVID-19, Russia's military incursion into Ukraine and the related global supply chain constraints have impacted our business, operating results and financial condition, as well as the operations and financial performance of many of the customers and suppliers in industries that we serve. We have experienced order and production delays, disruptions in component availability, increased pricing both for labor and parts, lower levels of factory utilization and higher logistics and operational costs. Such business conditions are expected to continue during our fourth quarter of fiscal 2022 and carry into fiscal 2023.
Former CEO Transition Costs
On December 31, 2021, our Board of Directors appointed Michael D. Porcelain as Chief Executive Officer (“CEO”). Prior to that, Mr. Porcelain served as our President and Chief Operating Officer (“COO”). Transition costs related to our former CEO, Mr. Kornberg, were $13,554,000 and all expensed in our second quarter of fiscal 2022. Of such amount, $10,304,000 related to Mr. Kornberg's severance payments and benefits upon termination of his employment; the remainder related to Mr. Kornberg agreeing to serve as a Senior Technology Advisor for a minimum of two years. Of the total former CEO transition costs of $13,554,000, $7,388,000 relates to the amortization of equity-classified stock-based awards.
Free historical financial statements for Comtech Telecommunications Corp. See how revenue, income, cash flow, and balance sheet financials have changed over 63 quarters since 2010. Compare with CMTL stock chart to see long term trends.
Data imported from Comtech Telecommunications Corp SEC filings. Check original filings before making any investment decision.